Here is a question that will break most AI agents: Why is my customer_orders table slow, and what should I do about it?
A human platform engineer would check the small-file count (940 files, most under 8 MB from streaming ingestion), notice 847 accumulated snapshots pinning 1.2 TB of dead storage, see that manifests have fragmented to 12× the optimal count, and know that the fix is compaction first, then snapshot expiry, then manifest rewrite — in that order, because reversing the sequence wastes compute. This entire diagnosis lives in Iceberg metadata — the same metadata that makes connecting AI agents to an Iceberg lakehouse both powerful and complex. None of it requires reading a single row of data.
An AI agent with SQL access? It will SELECT COUNT(*) FROM customer_orders, confirm the table has records, and tell you everything looks fine. It has no visibility into the metadata layer where the actual problem lives — and no structured way to access the maintenance signals, health scores, or operational sequencing rules that turn diagnosis into action.
This is the gap that the Model Context Protocol (MCP) fills for Iceberg operations. Not as a better SQL interface, but as a purpose-built tool layer that encodes the operational knowledge data engineers carry in their heads — the signals to check, the thresholds that matter, the sequencing constraints that prevent wasted work — and exposes it to any AI agent through a standardized, discoverable protocol.
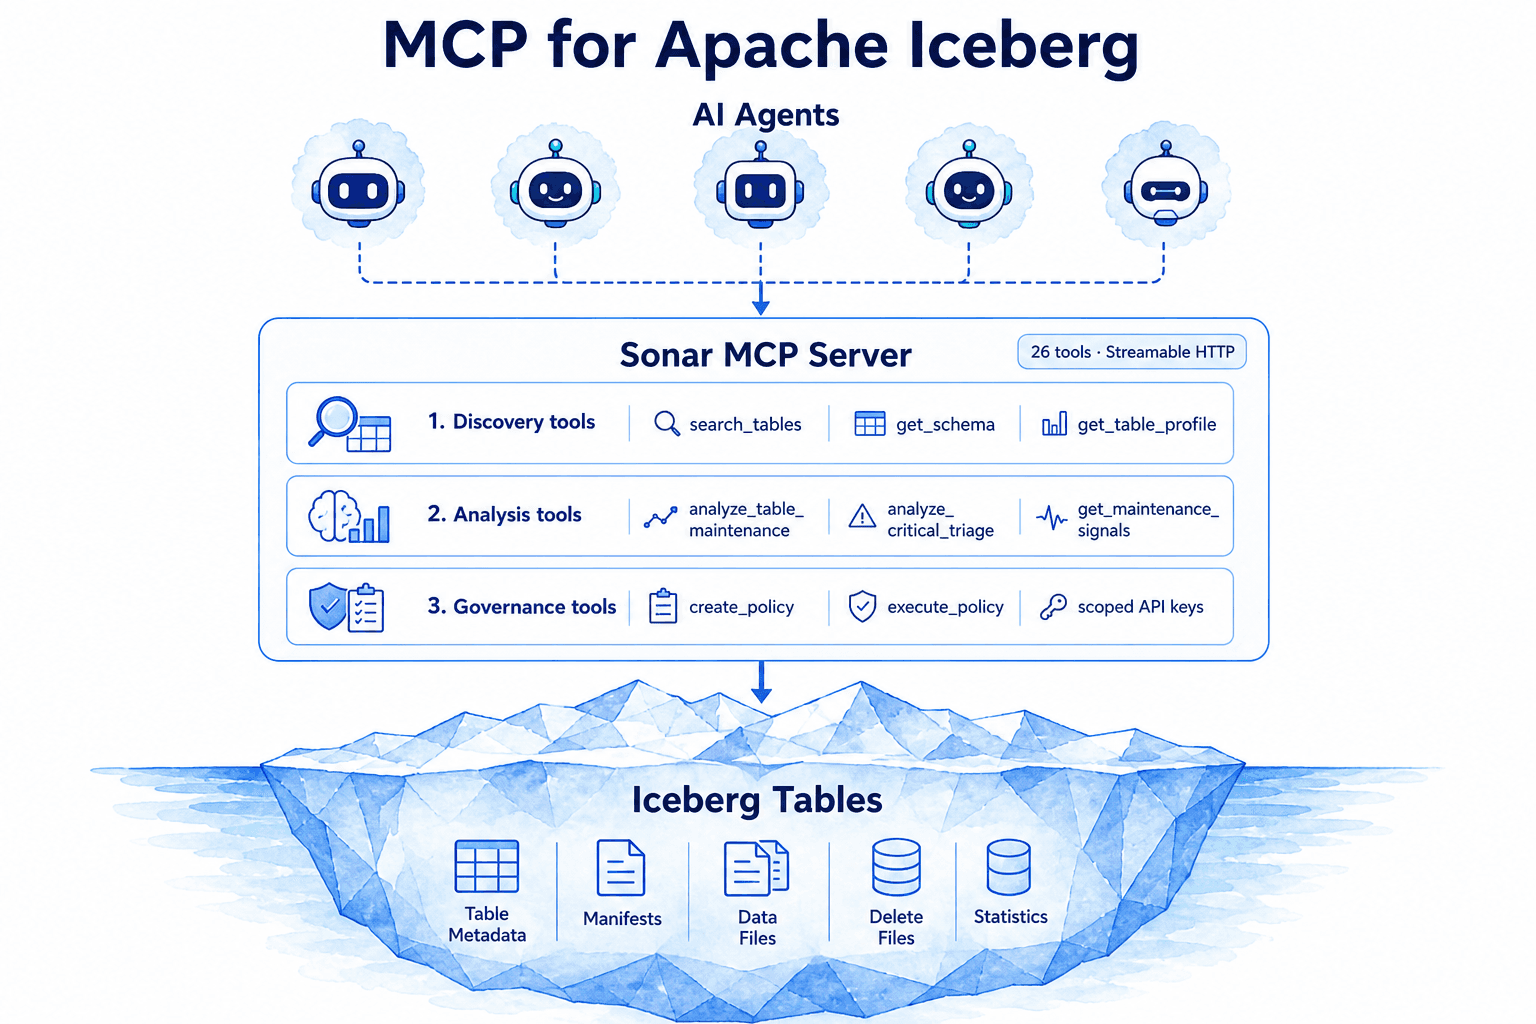
LakeOps ships a production MCP server with 27 tools across discovery, analysis, and governance. Connect your MCP client, authenticate with a scoped API key, and every agent in your organization inherits structured access to Iceberg table health, adaptive maintenance signals, and policy management — without custom integration code, without engine-specific SQL, and without hoping the model knows what needs_compaction means.
The metadata blindness problem
Every production Iceberg lake has a hidden operational layer that determines query performance, storage costs, and pipeline reliability — and it is completely invisible to agents that only speak SQL.
A single Iceberg table carries layered metadata: snapshots tracking every commit, manifest lists indexing those snapshots, manifest files mapping data files to partitions, partition specs defining how data is organized, sort orders controlling file layout, delete files marking row-level changes, and Puffin statistics files holding column-level stats. Query engines navigate this through the Iceberg REST catalog API. They plan queries by reading manifests, prune partitions using statistics, and skip irrelevant files. This is the layer that makes Iceberg fast.
But this is also the layer that degrades. Streaming ingestion creates thousands of undersized files that inflate query planning time. Every write appends a snapshot; without expiry, hundreds accumulate and pin terabytes of unreachable storage. Manifests fragment as files are added and removed. Delete files pile up, forcing engines to reconcile row-level changes at read time. Each of these degradation patterns is detectable from metadata alone — no table scan required — but only if you know what to look for and how to interpret the signals.
AI agents connected through generic SQL endpoints are blind to all of this. They see tables as queryable surfaces. They do not see file distributions, snapshot accumulation rates, manifest-to-file ratios, or partition skew. They cannot distinguish a healthy 10 TB table from a 10 TB table that is 40% dead storage. And critically, they have no way to express or act on the maintenance operations that fix these problems — compaction, snapshot expiry, orphan cleanup, manifest rewriting — because these are not SQL operations. They are control-plane operations.
This is not a limitation of the model. GPT-4, Claude, and every other foundation model can reason over structured maintenance signals perfectly well when given them. The limitation is that no standard interface existed to get those signals from the data lake to the agent — until MCP.
What MCP actually is (and why now)
MCP is an open protocol for connecting AI models to external tools and data sources. It standardizes how agents discover what operations are available, invoke them with structured arguments, and receive structured results — the same way REST APIs standardized how web applications talk to services, and JDBC standardized how applications talk to databases.
The protocol defines three primitives: tools (functions agents can call), prompts (pre-built workflows agents can follow), and resources (data sources agents can read). Each tool has a typed schema, a natural-language description, and optional annotations like readOnlyHint and destructiveHint that tell clients whether a tool reads data or modifies it.
Before MCP, connecting an agent to an Iceberg data lake meant one of three paths — all painful:
- Custom API wrappers — You build a REST API that exposes table health metrics, then write glue code to register each endpoint as a tool in your agent framework (LangChain, CrewAI, custom). When you add a new metric or change a response shape, you update the API, the glue code, the system prompt, and every agent that depends on it. This works for a demo. It collapses at 20+ tools across a team.
- Direct SQL access — You give the agent a JDBC connection string and a system prompt that says "Query these tables carefully." The agent skips schema discovery, hallucinates table names, and runs
SELECT *on a 2 TB table. When it does find the right table, it has no way to check health status or trigger maintenance. It is a reader with no operational awareness. - Copy-paste context — Your on-call engineer screenshots the dashboard, pastes it into a chat window, and asks the agent to interpret it. The context is stale within hours. The agent cannot drill into specific tables. The workflow is manual, fragile, and scales to exactly one incident before the engineer gives up.
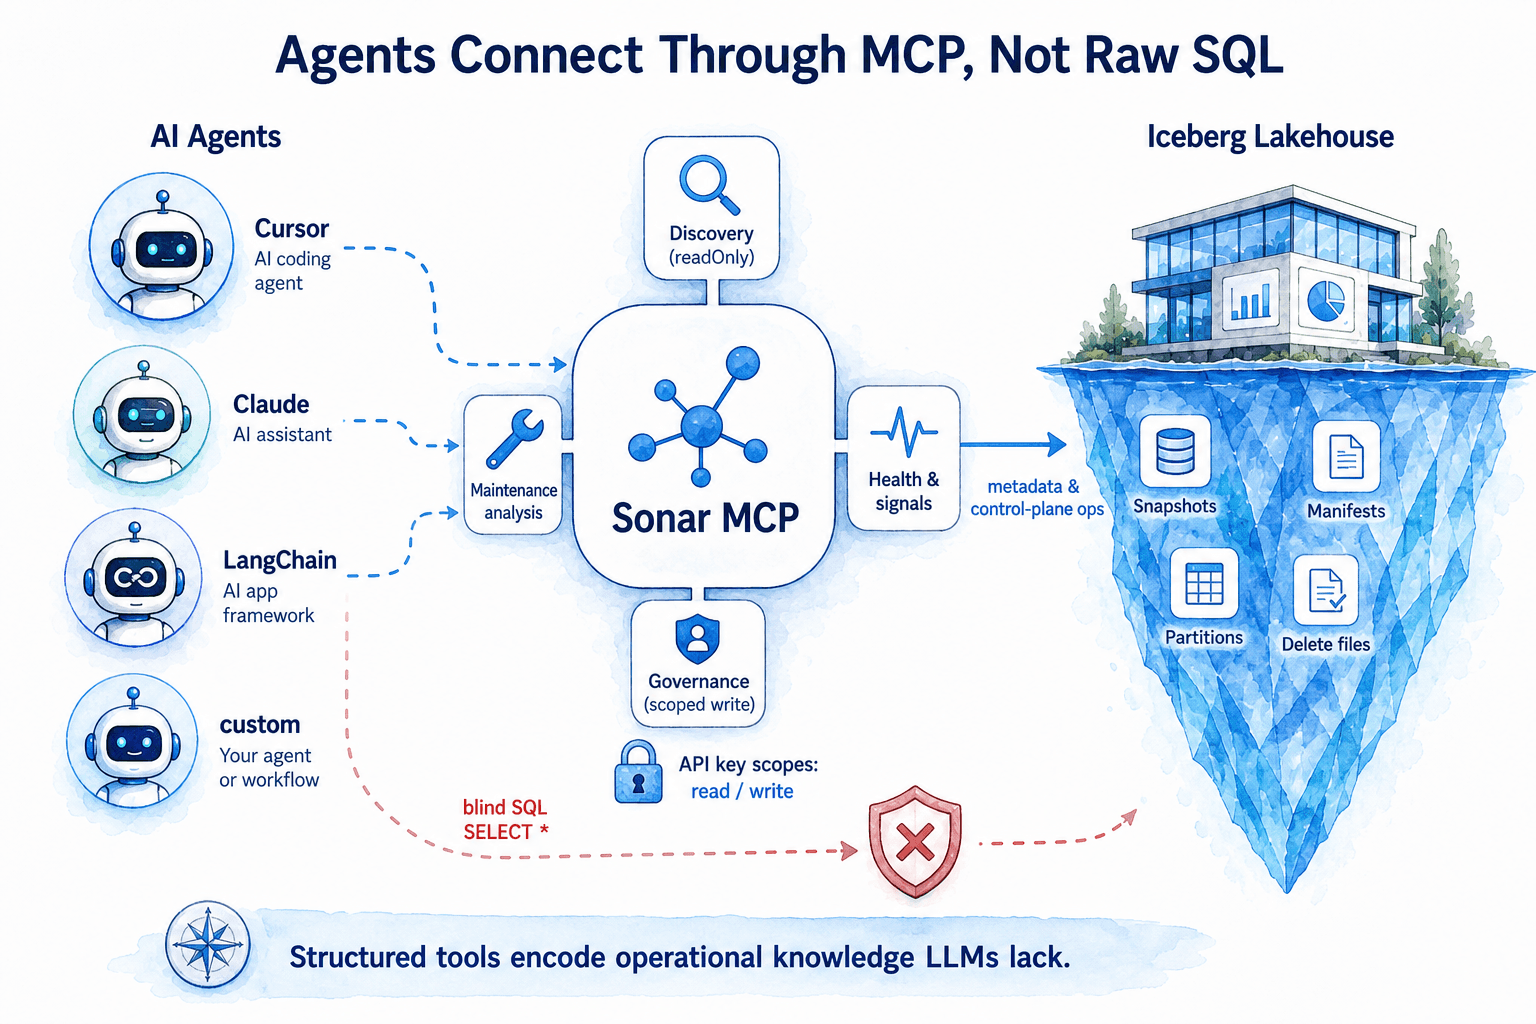
MCP replaces all three with a single, standardized interface. Configure your MCP client once — Cursor, Claude Desktop, LangChain, or any MCP-compliant agent — and every agent inherits the same tool surface, authentication, and permission scopes. Add a new tool on the server, and every connected agent discovers it automatically. No glue code, no prompt engineering, no per-agent maintenance.
The timing is not accidental. AI agents are moving from demos to production workloads: on-call assistants triaging table health at 2 AM, data engineers automating maintenance decisions across hundreds of tables, analyst copilots exploring schemas across catalogs they have never seen. These agents need structured, safe access to Iceberg metadata — and they need it now, not after the ecosystem converges on a single agent framework. Building an AI-ready data lake starts with giving agents the right interface.
Why Iceberg specifically needs purpose-built MCP tools
Not every system benefits equally from MCP. A simple key-value store might get by with three tools: get, set, delete. Iceberg demands a richer tool surface because the operational domain is genuinely complex. Three properties of production Iceberg deployments make purpose-built tools essential.
The answer is always in the metadata
When an agent asks "Why is this table slow?", the answer is never in the data rows. It is in the metadata: 940 small data files inflating planning time (POOR_FILE_DISTRIBUTION), 847 snapshots pinning 1.2 TB of dead storage (EXCESSIVE_SNAPSHOTS), manifests bloated to 340 MB (EXCESSIVE_MANIFESTS), or a partitioning scheme that funnels 80% of writes into a single partition value (PARTITION_SKEW).
Raw Iceberg metadata JSON (metadata.json) contains everything needed for this diagnosis — schemas, partition specs, snapshot history, table properties. But it is dense, deeply nested, and Iceberg-specific. An agent parsing raw metadata needs to understand that source-id in a partition spec refers to a column index in the schema, that manifest-list paths point to Avro files containing file-level stats, and that snapshot summary fields like added-data-files reveal write patterns over time.
A purpose-built get_schema tool returns the current column layout — names, readable types, identifier columns, partition_by, and sort_by — without the full Iceberg metadata payload. For historical schemas, snapshots, refs, and raw metadata JSON, use get_table_metadata.
A purpose-built get_table_insights tool goes further. Instead of expecting the agent to derive health conclusions from raw stats, it returns typed insight objects: POOR_FILE_DISTRIBUTION with smallFileCount: 940, avgFileSizeBytes: 7_340_032; EXCESSIVE_SNAPSHOTS with snapshotCount: 847, expirableSnapshotsCount: 820, potentialStorageSavingsBytes: 1_319_413_953_536. Each insight includes severity (CRITICAL, WARNING, INFO), a human-readable message, and a recommendation. The model does not need to know what thresholds define "excessive" — the tool encodes that knowledge.
Maintenance is a decision problem with sequencing constraints
Diagnosing a table is only half the challenge. The other half is deciding what to do — and in what order.
Iceberg tables degrade through four independent mechanisms, each requiring a different maintenance operation: compaction merges small files into larger ones, snapshot expiry removes old snapshots and the data they pin, orphan cleanup deletes unreferenced files from storage, and manifest rewriting consolidates fragmented metadata files. In production, most unhealthy tables need a combination of these operations — and the order matters.
Snapshot expiry should precede orphan cleanup, because expiry marks files as unreferenced and cleanup deletes them. Running cleanup first misses the files that expiry would have freed. Compaction should precede manifest rewriting, because compaction changes the file set and the manifests generated during compaction are already optimal. Rewriting manifests before compaction wastes compute on a file layout that is about to change. (For the full sequencing logic, see autonomous Iceberg table maintenance.)
A generic SQL endpoint cannot express any of this. An agent with SQL access can diagnose "too many small files" (if it knows the right system table query for the specific engine), but it cannot say "Compact first, then expire snapshots from 847 to 10, then rewrite manifests — and skip orphan cleanup because no snapshot expiry policy exists yet."
LakeOps's get_maintenance_signals tool returns exactly this: needs_compaction with a normalized score, needs_expire_snapshots with projected trigger time, needs_rewrite_manifests with manifest count and total size — plus last_compaction_at, last_expire_at, and in-progress/cooling state so the agent knows whether maintenance is already running. The analyze_table_maintenance tool goes further: it preloads the full table profile, effective governance policies, and the last 20 events, then returns a structured recommendation bundle that includes do-nothing decisions when maintenance cost exceeds benefit.
This is operational knowledge encoded into the tool layer. Instead of expecting every agent to know that snapshot expiry must precede orphan cleanup, or that a STALE_TABLE insight with low write activity warrants a do-nothing recommendation, the tools embed that logic and return actionable guidance.
Multi-engine reality breaks per-engine access
Production Iceberg lakes serve Trino, Spark, Snowflake, Athena, DuckDB, and Flink from the same tables. Each engine speaks a different SQL dialect, exposes different system tables (or none at all), and reports different metadata. An agent connected via Trino cannot inspect table health the same way an agent connected via Spark would. An agent connected via Athena cannot even access snapshot history programmatically.
A control-plane MCP server sits above the engine layer. It reads Iceberg metadata directly from catalogs — Glue, REST/Polaris, Nessie, Gravitino, S3 Tables — and presents a single, engine-agnostic tool surface. The agent calls search_tables, filters by status=CRITICAL, and gets consistent health status, file counts, and maintenance signals regardless of which engine wrote the data or which catalog hosts it. No SQL dialect translation. No engine-specific system table queries. One interface across the entire lake.
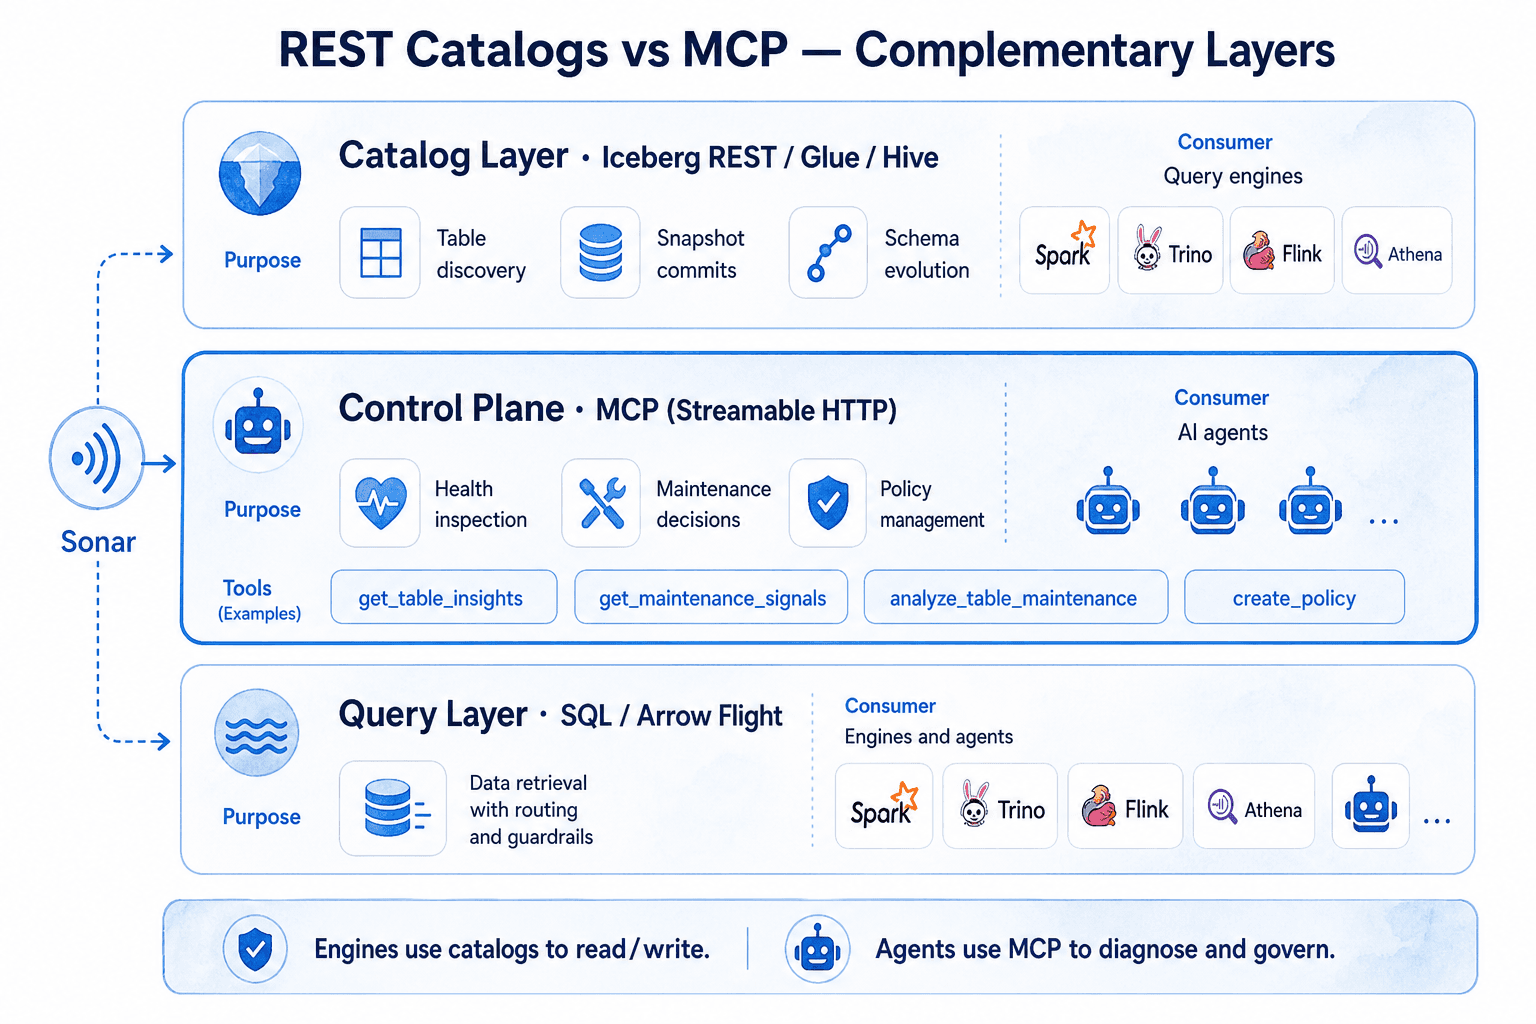
REST catalogs vs MCP: complementary, not competing
A common misconception is that MCP replaces REST catalogs. It does not. They serve different consumers at different layers.
| Layer | Protocol | Consumer | Purpose |
|---|---|---|---|
| Catalog | Iceberg REST / Glue / Hive | Query engines | Table discovery, snapshot commits, schema evolution |
| Control plane | MCP (Streamable HTTP) | AI agents | Health inspection, maintenance decisions, policy management |
| Query | SQL / Arrow Flight / PostgreSQL wire | Engines and agents | Data retrieval with routing and guardrails |
REST catalogs answer: "What tables exist, and how do I commit a new snapshot?" MCP answers: "Which tables are degrading, why, and what should we do about it?" An engine uses the REST catalog to read and write data. An agent uses MCP to understand, diagnose, and govern that data. Different consumers, different questions, complementary protocols.
How agents actually use these tools: a triage walkthrough
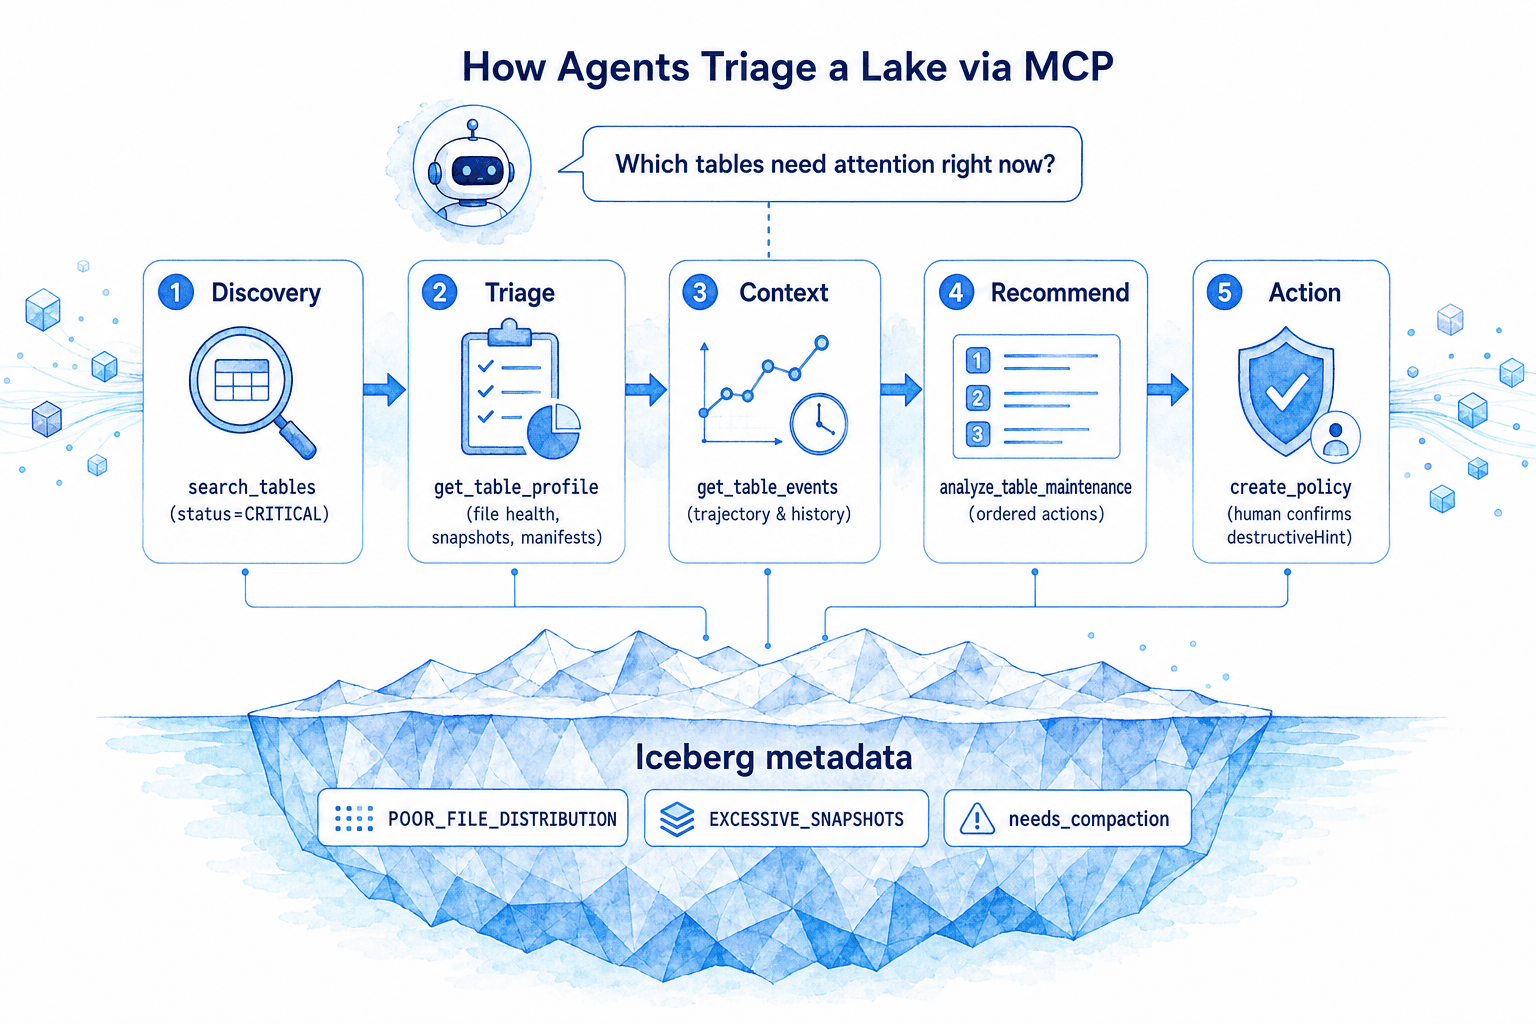
Abstract descriptions of tools are less useful than seeing them work. Here is what happens when a platform engineer asks their Cursor-connected agent: "Which tables need attention right now?"
Step 1 — Discovery. The agent calls search_tables with status=CRITICAL, sorted by tableSizeInBytes descending. It receives a list of tables with their catalog, namespace, name, size, record count, delete file count, and health status. No hallucinated table names — discovery is a structured tool call with structured output, not a prompt-engineering trick.
Step 2 — Triage. For the top table — say analytics.events.page_views at 4.2 TB, status CRITICAL — the agent calls get_table_profile. This single call returns normalized signals: file health (small file count, average file size, compactable bytes), delete pressure (delete file count, delete ratio by partition), snapshot bloat (snapshot count, expirable count, potential storage savings), manifest bloat (manifest count, total manifest size), and maintenance decisions with scores. It also returns health_signals[] — plain-language bullets like "940 small data files (avg 7 MB) — compact to reduce planning time by ~80×" that the agent can relay directly to the user.
Step 3 — Context. If the engineer asks "What happened to this table recently?", the agent calls get_table_events. It sees that the last compaction ran 18 days ago (reduced files from 1,200 to 14, but streaming ingestion has since created 940 new small files), snapshot expiry has never run, and no governance policies are attached. The agent now understands not just the current state but the trajectory — this table generates small files faster than maintenance is clearing them.
Step 4 — Recommendation. The agent calls analyze_table_maintenance, which preloads the profile, effective policies, and event history, then returns structured recommendations: enable ADAPTIVE_MAINTENANCE to handle compaction continuously, set snapshot retention to 10 with a 7-day age window, defer orphan cleanup until after expiry is established. Each recommendation cites concrete metrics — not vague advice, but specific configurations grounded in the table's actual state.
Step 5 — Action (optional). If the engineer says "Go ahead and create that policy," a write-scoped agent calls create_policy with type ADAPTIVE_MAINTENANCE, the table's catalog and namespace, and the recommended config. The destructiveHint annotation on execute_policy means MCP clients like Cursor prompt for confirmation before triggering execution — the agent proposes, the human approves.
This entire workflow — from lake-wide triage to table-specific diagnosis to policy creation — happens through structured tool calls, as detailed in how AI agents query Apache Iceberg data with MCP. No SQL. No dashboard screenshots. No system prompt gymnastics to teach the agent about manifest-to-file ratios.
The 27 tools: discovery, analysis, governance
LakeOps's MCP server exposes tools in three categories, each designed around a specific agent workflow pattern.
Discovery tools — structured context before action
list_catalogs returns every connected Iceberg catalog with table counts and total size. list_namespaces shows the namespace hierarchy within a catalog. search_tables filters across the entire lake by name, catalog, namespace, health status, and sort order — the query argument is optional when filtering by catalog or status alone. get_lake_health returns the 30-day org-wide health dashboard — total operations, storage reclaimed, health tier breakdown, and compaction metrics across every catalog.
For individual tables: get_table_details returns size, record count, delete files, and health tier. get_schema returns the current column layout (columns, partition_by, sort_by) — prefer it for structure questions. get_table_metadata returns full Iceberg metadata plus the ai_context block when you need snapshots, refs, or historical schemas. get_table_insights explains why a table is WARNING or CRITICAL with typed insight objects. get_maintenance_signals returns adaptive scores, projected trigger times, and accumulation rates. get_table_profile rolls stats, insights, signals, and health_signals[] into one call — prefer this over calling the three individually.
For partition-level diagnosis: get_partition_distribution exposes file counts, sizes, delete ratios, and file-size histograms per partition with pagination and search. get_hot_partitions ranks the most problematic partitions by file count and record count, with a skew_signal when the hottest partition exceeds 10× the average. get_table_scan_cost_hints estimates full-scan cost from live stats before an agent recommends an expensive operation. get_table_events returns full operation history with per-event impact metrics.
This layered discovery prevents the most common agent failure mode: hallucinated table names. When agents discover Iceberg data through structured tool calls, they call schema discovery first. When discovery is buried inside a generic SQL endpoint, agents skip it and guess.
Analysis tools — embedded operational expertise
Analysis tools preload live data and return { title, instructions } — structured guidance the agent follows, not mutating operations. This design encodes expert knowledge directly into the tool layer.
analyze_table_maintenance is the most important: it loads a table's full profile (stats + signals + insights), effective governance policies, and the last 20 events, then returns a structured decision framework — executive summary, per-action rationale with concrete metrics, ordered recommendations, deferred actions with gates, and safety notes. The agent does not need to independently derive that compaction should precede manifest rewriting — the tool's instructions encode that sequencing.
analyze_lake_health preloads the 30-day org-wide dashboard and CRITICAL tables for executive summaries. analyze_table_health focuses on a single table — loading its profile, policies, and recent events to produce a comprehensive health assessment. analyze_compaction surfaces tables with small-file and high-delete problems. analyze_critical_triage ranks on-call priorities across the lake. analyze_storage_reclaim identifies snapshot-bloat and largest-table opportunities for storage recovery. analyze_policy_gaps compares maintenance insights against existing governance policies to find unprotected tables.
Governance tools — scoped write access
Write-scoped tools manage governance policies: list_policies returns all existing policies with their status and scope, create_policy, update_policy, enable_policy, disable_policy, and execute_policy. Only execute_policy carries destructiveHint — other write tools define or update policies but do not run maintenance directly. MCP clients that support tool annotations prompt for confirmation before agents trigger policy execution.
API keys carry independent permission scopes — read for discovery and analysis, write for policy management. A read-only on-call agent needs read scope only. Agents that discover and then govern need both read and write — write does not implicitly include read. Calls without the required scope return an explicit error, not silent failure.

Why purpose-built tools beat `execute_sql`
The temptation with any new protocol is to expose a single execute_sql tool and call it done. For Iceberg operations, this fails in four specific ways.
Agents skip discovery — reliably. With a generic SQL endpoint, agents jump to querying. They invent table names, guess column types, and produce confident-sounding wrong answers. In our testing, agents given a SQL endpoint skip schema discovery calls more than 70% of the time. Agents given purpose-built discovery tools (list_catalogs → search_tables → get_table_details) follow a discovery-first workflow because the tool surface makes it the natural path.
Iceberg diagnostics are not expressible in portable SQL. needs_compaction, compaction_score: 0.87, projected_trigger_time: 2026-07-12T03:00:00Z, adaptive maintenance signals — these are control-plane concepts with no SQL equivalent on any engine. Exposing them as dedicated tools (get_maintenance_signals, get_table_profile) gives agents the exact signals operators use, without reverse-engineering from engine-specific system tables that may not exist.
Safety requires tool-level granularity. MCP supports readOnlyHint and destructiveHint annotations on tools — a key mechanism for safe AI agent access to Apache Iceberg in production. Every discovery and analysis tool is marked read-only. Only execute_policy is marked destructive. Clients like Cursor and Claude Desktop use these hints to show confirmation dialogs before agents trigger potentially dangerous operations. A generic SQL endpoint has no such granularity — DROP TABLE and SELECT 1 travel the same path.
Token efficiency matters at agent scale. Raw Iceberg metadata JSON for a moderately complex table consumes 3,000–8,000 tokens. A structured ai_context block with the same information — schema, partition spec, sort order, snapshot stats — fits in 300–500 tokens. At 50 tool calls per agent session across hundreds of concurrent sessions, this is the difference between agents that fit their reasoning in-context and agents that truncate critical information. (For the broader architecture of optimizing Iceberg for agentic AI, see the companion deep dive.)
Real-world patterns
On-call triage at 2 AM
A platform engineer's pager fires. Instead of opening the dashboard, SSHing into a bastion, and running diagnostic queries against three different engines, they open Cursor and type: "Which tables are CRITICAL right now and why?"
The agent calls analyze_critical_triage, receives preloaded CRITICAL and WARNING tables ranked by urgency, and produces a remediation plan in 15 seconds — citing concrete metrics for each table: page_views has 940 small files and needs compaction, payment_transactions has 847 snapshots pinning 1.2 TB and needs expiry, user_sessions has high delete-file ratio in the region=us-east-1 partition. The engineer triages three tables before their coffee gets cold.
Continuous maintenance governance
A data engineering team manages 400+ Iceberg tables across three catalogs. They cannot manually check each table's health. A nightly agent workflow calls analyze_policy_gaps, compares tables with maintenance insights against existing governance policies, and surfaces gaps: 12 tables with compaction signals but no ADAPTIVE_MAINTENANCE policy, 8 tables eligible for snapshot expiry without a retention policy, 3 catalog-level policies that should be table-attached because the tables have unique characteristics.
For each gap, the agent calls analyze_table_maintenance to generate a recommendation, then either creates a policy via create_policy or produces a summary for human review. Tables that are healthy or already covered by policies get a do-nothing recommendation — the agent knows when not to act, because the analysis tools encode that judgment. This is managed Iceberg maintenance driven by agents instead of manual runbooks — the operational model at the heart of an AI lakehouse for self-managing data lakes.
Executive lake health reporting
A weekly agent workflow calls get_lake_health, pulls 30-day metrics — total operations, storage reclaimed, health tier breakdown across catalogs, compaction file reduction percentages — and generates an executive summary. The report includes trend analysis: "CRITICAL tables decreased from 70 to 23 this month. Total storage reclaimed by snapshot expiry: 4.8 TB. Average query acceleration from compaction: 12.4×." No dashboard screenshots, no manual export — the agent reads live control-plane state and writes the report.

Partition-level diagnosis
A query performance regression on analytics.clickstream stumps the usual checks — table-level stats look normal. The agent calls get_hot_partitions and discovers that date=2026-07-10 has 1,847 files while the average partition has 45 — a skew signal of 41×. It then calls get_partition_distribution for that partition and finds that 95% of the files are under 2 MB, created by a burst of CDC events. The diagnosis is partition-specific small-file accumulation — the agent recommends a targeted compaction with a whereClause filter on that partition rather than a full-table rewrite.
Closing the feedback loop with observability
MCP is not just an input channel. Combined with LakeOps lakehouse observability, it closes a feedback loop: agents inspect health via MCP, maintenance operations run (autonomously or on approval), results appear in event history, and agents verify impact on the next cycle.
get_table_events returns full operation history with impact metrics: compaction events show input vs. output file counts and sizes, snapshot expiry shows deleted snapshot count and bytes freed, orphan cleanup shows bytes reclaimed. An agent that recommended compaction on Monday can verify on Tuesday that file count dropped from 940 to 12, average file size increased from 7 MB to 512 MB, and query planning time improved — without asking a human to check.
This is the difference between agents as chat interfaces and agents as operational participants. MCP gives them read access to the same telemetry operators use. Scoped write access lets them propose and enact governance changes. The control plane executes, records, and reports — the agent verifies, learns, and adapts.
Getting started in two steps
Connecting an MCP client to LakeOps takes two steps. The MCP server documentation includes a region picker that fills in the correct URL for your organization.
1. Create a scoped API key. An org admin creates a key in Organization > API Keys with the permissions your agent needs. Start with read scope — it covers all discovery and analysis tools. Add write when you are ready for policy management. Scopes are independent: write does not include read, and agents that discover data and then manage policies need both.
2. Configure your MCP client. LakeOps runs one MCP endpoint per data region — the same region you selected when creating your organization:
- US East (
us-east-1):https://api.lakeops.dev/mcp - Asia Pacific / Mumbai (
ap-south-1):https://api-in.lakeops.dev/mcp - Asia Pacific / Tokyo (
ap-northeast-1):https://api-jp.lakeops.dev/mcp - EU West / Ireland (
eu-west-1):https://api-eu.lakeops.dev/mcp
A region mismatch is the most common setup mistake — an API key for a Mumbai org against the US endpoint returns empty catalogs with no obvious error. Match the host to your organization's data region.
1{2 "mcpServers": {3 "lakeops-us-east-1": {4 "url": "https://api.lakeops.dev/mcp",5 "headers": {6 "Authorization": "Bearer <your-api-key-us-east-1>"7 }8 },9 "lakeops-ap-south-1": {10 "url": "https://api-in.lakeops.dev/mcp",11 "headers": {12 "Authorization": "Bearer <your-api-key-ap-south-1>"13 }14 },15 "lakeops-ap-northeast-1": {16 "url": "https://api-jp.lakeops.dev/mcp",17 "headers": {18 "Authorization": "Bearer <your-api-key-ap-northeast-1>"19 }20 },21 "lakeops-eu-west-1": {22 "url": "https://api-eu.lakeops.dev/mcp",23 "headers": {24 "Authorization": "Bearer <your-api-key-eu-west-1>"25 }26 }27 }28}Drop this into .cursor/mcp.json for Cursor or claude_desktop_config.json for Claude Desktop. For a complete walkthrough, see connecting AI agents to Apache Iceberg with MCP. Teams spanning multiple regions can register one server per region (e.g., lakeops-us-east-1, lakeops-ap-south-1, lakeops-ap-northeast-1, and lakeops-eu-west-1). The MCP setup docs let you pick your data regions and copy a ready-made config.
Start with the analysis tools — ask your agent to triage CRITICAL tables or summarize lake health. You will get structured, metrics-backed answers in seconds that would take 30 minutes of dashboard clicking and query running to assemble manually. Once you trust the recommendations, add write scope for policy management.
The bigger picture
The lakehouse stack now has three standard interfaces, each serving its consumer: object storage for data files, REST catalogs for query engines, and MCP for AI agents. Each layer was preceded by the same dynamic — fragmented, ad-hoc integrations that every team rebuilt from scratch, until a standard emerged and everyone benefited.
For Apache Iceberg specifically, MCP fills a gap that REST catalogs were never designed to cover. REST catalogs tell engines where tables live and how to commit changes. MCP tells agents which tables are healthy, which are degrading, what to do about it, and whether the last fix worked. It encodes the operational knowledge — the maintenance sequencing, the health thresholds, the do-nothing decisions — that makes the difference between an agent that generates plausible suggestions and an agent that operates your data lake.
The agents that succeed in production will not be the ones with the most elaborate system prompts. They will be the ones connected to structured, scoped, purpose-built tools that encode operational knowledge the model cannot infer from its training data. For the complete picture of what this means in practice, see our guide to making your Iceberg lakehouse AI-ready. LakeOps ships this interface today — connect your catalogs, point your MCP client at the regional endpoint, and give every agent in your organization the same lake-wide visibility that your best platform engineer has.
Further reading
- Iceberg Lakehouse with AI Agents: A Guide — the five infrastructure components for production agentic workloads
- Iceberg for AI Agents: Turning Lakehouse Data Into AI-Ready Context — structured RAG, schema-aware agents, and governed reasoning on Iceberg
- Iceberg Lakehouse Observability Guide — metrics, health tiers, and telemetry that power MCP analysis tools
- MCP Server Setup — regional endpoints, interactive client config, full tool reference, and permission scopes