





Managed Iceberg Tables

Iceberg table maintenance that runs itself

Compaction, snapshot expiry, orphan cleanup, and manifest rewrite — triggered by table health, run in dependency order. No cron jobs, no per-engine Spark scripts.

76%Cost reduction
12×Faster queries
95%Faster compaction
LakeOps LogoLakeOps

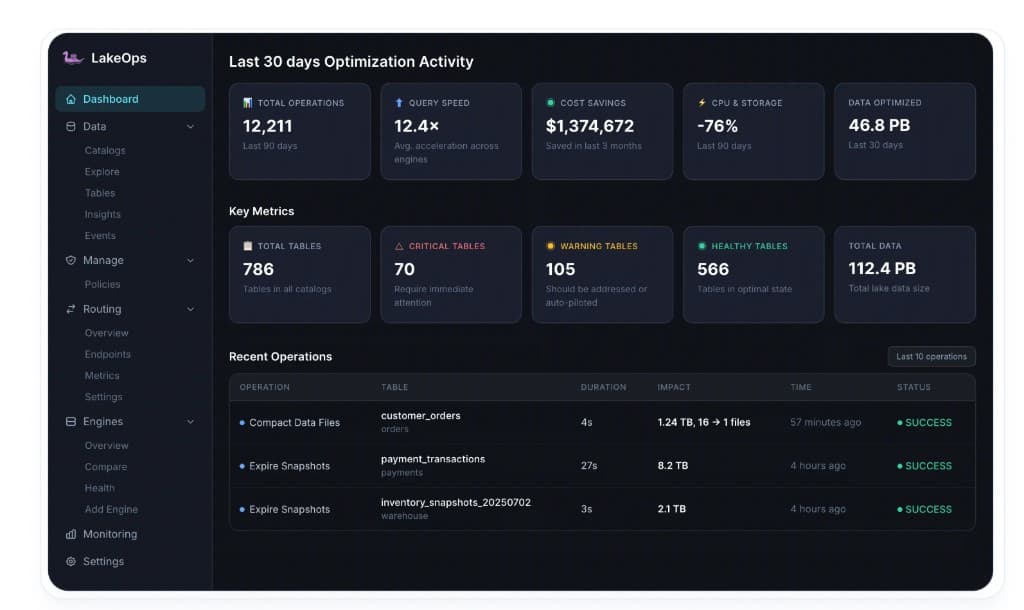
Last 30 days Optimization Activity

Total Operations
12,211
Last 90 days
Query Speed
12.4×
Avg. acceleration across engines
Cost Savings
$1,374,672
Saved in last 3 months
CPU & Storage
-76%
Last 90 days
Data Optimized
46.8 PB
Last 30 days

Key Metrics

Total Tables
786
Tables in all catalogs
Critical Tables
70
Require immediate attention
Warning Tables
105
Should be addressed or auto-piloted
Healthy Tables
566
Tables in optimal state
Total Data
112.4 PB
Total lake data size

Storage

-56% reclaimed
30d
112 TB75 TB38 TB
Storage used

CPU

-76% reduction
30d
100%66%33%
Compute hours

Recent Operations

Last 10 operations
OperationTableDurationImpactTimeStatus
Compact Data Files
customer_orders
orders
4s1.24 TB, 16 → 1 files57 minutes agoSUCCESS
Expire Snapshots
payment_transactions
payments
27s8.2 TB4 hours agoSUCCESS
Expire Snapshots
inventory_snapshots_20250702
warehouse
3s2.1 TB4 hours agoSUCCESS
Rewrite Manifests
raw_clickstream
analytics
1.9s3 → 1 manifests5 hours agoSUCCESS
Compact Data Files
product_catalog
products
6m 11.3s3,008 → 1,256 files6 hours agoSUCCESS

Lake Events

LiveLast 24 hours
Compact Data Files·customer_orders
ecommerce_prod·1.24 TB, 16 → 1 files
4s57 min agoOK
Expire Snapshots·payment_transactions
ecommerce_prod·12 snapshots expired
4.6s1h agoOK
Compact Data Files·raw_clickstream
marketing_events·970 → 87 files
9m 31.6s2h agoOK
Remove Orphan Files·user_sessions
marketing_events·847 MB reclaimed, 1,203 files
1m 12s3h agoOK
Rewrite Manifests·search_query_logs
ecommerce_prod·487 → 12 manifests
2.1s3h agoOK
Expire Snapshots·inventory_levels
warehouse_analytics·62 snapshots, 18.4 GB freed
27s4h agoOK
Compact Data Files·product_catalog
ecommerce_prod·3,008 → 1,256 files
6m 11.3s5h agoOK
Rewrite Manifests·shipping_events
warehouse_analytics·14 → 3 manifests
1.0s6h agoOK
Remove Orphan Files·balance_snapshots
warehouse_analytics·59,831 files, 74.8 GB
13m 6.9s7h agoOK
Compact Data Files·ad_impressions
marketing_events·42,633 → 69 files
2m 18s8h agoOK
No vendor lock-in
No code / infra changes
No data changes
REST API & MCP

Open and runs on your stack

AWS
Azure
Google Cloud
Snowflake
Databricks
Apache Flink
Apache Iceberg
Delta Lake
DuckDB
Dremio
Lakekeeper
ClickHouse
AWS
Azure
Google Cloud
Snowflake
Databricks
Apache Flink
Apache Iceberg
Delta Lake
DuckDB
Dremio
Lakekeeper
ClickHouse

How it works

From health signals to healthy tables — fully autonomous

LakeOps monitors every table, identifies what's degraded, sequences the right operations in the right order, and adapts cadence to each table's write pattern.

Table Health Overview786 tables
566
Healthy
105
Warning
70
Critical
92%
Optimized
TableNSSizeStatus
customer_ordersorders1.24 TBHEALTHY
payment_transactionspayments860 GBWARNING
raw_clickstreamanalytics4.6 TBCRITICAL
product_catalogproducts42 GBHEALTHY
user_sessionsanalytics1.9 TBWARNING
inventory_levelsoperations320 GBHEALTHY
shipping_eventslogistics580 GBHEALTHY
search_query_logsanalytics3.2 TBCRITICAL

01 · Table health intelligence

Every table monitored, scored, and prioritized

LakeOps continuously monitors file count, small-file ratio, delete-file depth, snapshot age, manifest bloat, and write velocity across every table in your lake. Each table is classified as Healthy, Warning, or Critical — the most degraded tables get attention first.

  • Lake-wide health grid — every table scored in real time
  • Priority ordering — worst-degraded tables run first
  • Every metric visible in the dashboard — nothing is a black box
Adaptive Maintenance
Running
Compaction Scope— what will be targeted this run

Monitoring started at seq #4,812. Everything written from that point on is in scope.

already compacted
38% hot zone — will compact
#4,812 baseline#7,104 watermark#8,506 now
📦Compaction
Last: 57 minutes agoNext: in 2h
62%
42% of data files are below the 384 MB size threshold
1.24 TB compactable — will merge into ~3 files at 512 MB target
16 delete files amplify read cost — compaction will absorb them
Snapshot Expiration
Last: 4 hours agoNext: in 20h
31%
12 of 83 snapshots have passed the retention window
Retention policy: 5.0 days
Table creates 3.2 snapshots/hr — stale ones accumulate quickly
📝Rewrite Manifests
Last: 5 hours agoNext: in 1h
78%
92 total manifests: 89 data + 3 delete
Accumulating 2.1 manifests/hr — metadata overhead grows
High manifest count degrades query planning and scan performance
🧹Orphan File Cleanup
Last: 7 hours agoNext: in 17h
15%
No orphan files detected in current scan window

02 · Adaptive maintenance sequencing

Every table gets the right operations at the right time

Snapshot expiry runs before compaction — so you never rewrite files about to be garbage-collected. Orphan cleanup follows. Manifest rewrite comes last. LakeOps sequences the full pipeline so each step's output is the next step's clean input, lake-wide, adapting cadence to each table's write pattern.

  • Expire → Compact → Clean → Rewrite — correct dependency order
  • Streaming tables run hourly, batch tables daily, healthy tables are skipped
  • No wasted work — expired data is never compacted
Compaction engineQuery-Aware

Files after compaction

970 → 87

Sorted by customer_id, event_date

Compaction Scope
already compacted
38% hot zone — will compact
Compact Data Files
SUCCESS
Duration
4.2s
Files in
970
Files out
87
Engine
Rust 2,500 MB/s
Strategy
Sort
Target
512 MB
Sort columns detected:customer_idevent_date

03 · Compaction

Sort and merge files for how your queries actually read them

Streaming writes fragment tables into thousands of tiny files. LakeOps merges them into optimally-sized files and sorts by the columns your queries actually filter, join, and group on — so engines skip irrelevant data via predicate pushdown.

  • Query-aware sort: learns WHERE, JOIN, and GROUP BY columns from production traffic
  • 970 → 87 files on a typical table — 62% fewer S3 GETs per query
  • Rust engine at 2,500+ MB/s — 95% faster and 90% cheaper than Spark
Snapshot expirationPolicy active

Metadata size after expiry

84% smaller

154 → 24 snapshots retained (30-day window)

Snapshot IDDateOpStatus
612885024939Today 08:32AppendRetained
871545978103Today 08:29AppendRetained
394820156873Today 07:14OverwriteRetained
250198374610Aug 22 14:01AppendExpired
718403926145Aug 20 09:33AppendExpired
483019275638Aug 18 11:47CompactExpired

Retention

30 days

Expired

130

Latency cut

−2.8s

04 · Snapshot expiration

Expire history safely — keep only what you need

Every Iceberg commit creates a snapshot. Without expiration, metadata grows until query planning stalls. LakeOps expires snapshots based on configurable retention, with concurrency awareness so in-flight reads are never broken.

  • Policy-based retention: 3 days to 90 days, per table or catalog-wide
  • Concurrency-safe: won't expire a snapshot still referenced by a running query
  • Time travel and one-click rollback remain available within the retention window
Orphan cleanupSequenced

Storage reclaimed

56% of lake

Dead data removed — zero impact on live queries

Object storage44% live · 56% reclaimed
Recent cleanup events
ice_html5_sdk_events
13.6 GB4,218 files1m 9s
ice_desktop_sdk_events
74.8 GB59,831 files13m 6s
daily_metrics_reddit
1.2 GB312 files< 1s
⚠ Files only removed if unreferenced in any snapshot and older than 7-day safety window

05 · Orphan file cleanup

Stop paying for data no query can reach

Failed writes, aborted compaction, and interrupted jobs leave files on storage that no snapshot references. They are invisible to queries but fully visible on your cloud bill. LakeOps detects and removes them after a safety window.

  • Set-difference scan: compares object storage listing against Iceberg metadata
  • 7-day safety window by default — no risk to in-flight jobs or late-arriving commits
  • Production sweeps routinely reclaim 20–40% of total lake storage
Manifest optimizationPlanner impact

Manifest files

487 → 12

97.5% fewer metadata reads per query plan

📝Rewrite Manifests
Last: 5h agoNext: in 1h
78%
487 total manifests: 484 data + 3 delete
Accumulating 2.1 manifests/hr — metadata overhead grows
High manifest count degrades query planning performance
Rewrite Manifests
SUCCESS
Duration
2.1s
Manifests in
487
Manifests out
12
Planner latency
3.4s → 1.3s
S3 GETs per plan
487 → 12

06 · Manifest rewriting

Keep query planning fast at any scale

Manifests are Iceberg's file-level index. Hundreds of small manifests from frequent commits force the query planner to open each one — adding seconds of latency before any data is read. LakeOps consolidates them into fewer, larger manifests.

  • 487 → 12 manifest files on a typical table — planner latency drops from 3.4s to 1.3s
  • Especially impactful with Iceberg 1.11 server-side scan planning
  • Runs after compaction so new file references are immediately consolidated
Delete file compactionMoR cleanup

Read-time reconciliation

0 delete files

Deletes physically applied — no read-side cost

Delete file accumulation per write cycleCompacted ↓
12
34
89
247
614
1,204
2,847

Before compaction

Position deletes2,847
Equality deletes412
Read overhead+1.8s/query

After compaction

Position deletes0
Equality deletes0
Read overhead0ms

07 · Delete file compaction

Apply deletes so reads stop paying for them

Merge-on-read tables accumulate position and equality delete files with every UPDATE or DELETE. Each read must reconcile live rows against all accumulated deletes. LakeOps rewrites affected data files to physically apply the deletes.

  • Eliminates per-read reconciliation overhead that grows with every write cycle
  • Critical for CDC, GDPR, and upsert-heavy workloads where deletes dominate
  • Iceberg 1.11 deletion vectors (Roaring bitmaps) supported natively
Statistics computationPuffin

Column coverage

100%

All columns indexed with NDV, min/max, null-count

ColumnNDVRangeNulls
customer_id1.2MC-00001 … C-999990%
event_date3652025-01-01 … 2026-08-250%
amount48K0.01 … 9,999.002.1%
region12ap-east-1 … us-west-20%

File pruning

94%

files skipped

Freshness

< 1h

post-compaction

Columns

16/16

tracked

08 · Statistics computation

Fresh statistics so engines skip entire files

Puffin column-level statistics and Parquet min/max bounds power predicate pushdown and file pruning. When statistics are missing or stale, engines scan more data than necessary. LakeOps computes and refreshes them automatically.

  • Puffin NDV, min/max, and null-count statistics across all indexed columns
  • Enables tighter file pruning — engines skip entire files based on column bounds
  • Refreshed after every compaction so statistics always reflect current file layout
Layout Simulations

Run simulations on customer_orders

Simulations 3metalayout
clusterByOrderDate
Partition: order_date → daily buckets. Cluster by customer_id, order_status. Sort: merchant_id, discount_pct
customer_id, order_status
141.6s
cluster.order_type.by.status
Partition: order_status = 'completed'. Rebuild partition keys: payment_method, currency.
order_status, payment_method
120.4s
cluster.insert-time-line
Partition: created_at → hourly. Sort by customer_id, store_id. File-size balanced partitions.
customer_id, store_id
89.2s
▸ Field access frequency by query mix
How this table's fields correlate — the foundation for choosing the right layout strategy.
order_id
customer_id
order_status
total_amount
item_ids
created_at
payment_method
discount_pct
02,000,0004,000,0006,000,0008,000,000
SELECTFILTERJOIN Rows
↕ Layout Customization Diff
Analyze layout changes across all selected simulations → highlight what sets differ from baseline.
Simulationdata_relStrategyAvg Size
metaclusterByOrderDatecustomer_id, order_statusorder_date (day)343 MB / file
metacluster.order_type.by.statusorder_status, payment_methodorder_status, payment_method511 MB / file
layoutcluster.insert-time-linecustomer_id, store_idcreated_at (hour)128 MB / file

09 · Layout simulations

Test sort strategies before you touch production

Not sure if sorting by event_date or customer_id will help most? LakeOps runs layout simulations on Iceberg branches — testing sort orders and partition strategies against real query patterns without modifying production data. Compare scan reduction, file layout, and estimated speedup side by side, then apply the winning strategy with one click.

  • Branch-based simulations — production tables stay untouched during testing
  • Compare sort strategies side by side: scan reduction, file count, query speedup
  • Apply the winning layout to production when you're ready — one action

Policies

Manage maintenance, configuration, and lifecycle policies for your data lakehouse

OnPolicyTypeNext RunLast RunUpdatedActions
orders_critical
Compact FilesApr 25, 2026, 8:12 AMApr 25, 2026, 03:05 AMFeb 01, 2025, 3:46 PM•••
payments_compact
Compact FilesFeb 15, 2026, 12:06 AMFeb 1, 2025, 02:18 PMFeb 5, 2025, 4:03 PM•••
Remove orphan files (e-ip...)
For all tables in all catalogs every 7 days
Orphan FilesApr 25, 2026, 8:12 AMApr 25, 2026, 04:07 PMJun 23, 2025, 04:01 PM•••
clickstream_cdc_events_p
Expire SnapshotsApr 25, 2026, 12:03 AMApr 25, 2026, 03:05 AMJan 28, 2025, 03:25 PM•••
sessions_cdc_events_p
Expire SnapshotsApr 25, 2026, 12:03 AMApr 26, 2026, 03:05 AMJun 26, 2025, 11:11 PM•••
global_expire_snapshots
Runs snapshot expiration on all tables once a day
Expire SnapshotsApr 26, 2026, 1:18 PMApr 07, 2026, 01:08 PMMar 14, 2026, 8:42 AM•••
manifest_rewrite_weekly
Rewrite manifests for all critical tables weekly
Rewrite ManifestsApr 28, 2026, 2:00 AMApr 21, 2026, 02:00 AMMar 10, 2026, 9:15 AM•••
staging_config
ConfigurationDec 31, 2025, 02:45 PM•••

10 · Declarative policies

Set rules once — every table follows them

Compaction thresholds, retention windows, cleanup schedules, and sort strategies — set them as declarative policies. LakeOps applies them across every catalog, namespace, and table. New tables inherit policies automatically, so nothing falls through the cracks. Every execution is logged with duration, impact, and outcome.

  • One-toggle policies for compaction, retention, orphan cleanup, and manifests
  • Scope inheritance — new tables comply from day one
  • Full audit trail: every policy change and enforcement action logged
  • Define and manage policies via console or REST API

Results

Cut costs and boost performance

Benchmarks from production-grade tables across multiple engines and clouds.

Query speed

12×faster

After compaction + layout optimization

CPU reduction

76%less compute

Compute hours across all engines

Storage saved

56%reclaimed

Orphans, snapshots & bloat removed

Table health

100%healthy

Autonomous maintenance keeps every table optimized

TPC-DS benchmark suiteProduction Iceberg tablesMulti-cloud, multi-engine

See It In Action

Watch how LakeOps keeps Iceberg tables healthy

Compaction, snapshot expiry, orphan cleanup, and manifest rewrite — all sequenced and autonomous.

Watch demoYouTube ↗
LakeOps — autonomous Iceberg table maintenance

The Challenge

Unmanaged Iceberg tables degrade — slowing queries and driving up costs

Without active maintenance, tables degrade silently — queries slow, costs grow, and every engine pays the price.

Rising costs & latency

Small files, stale snapshots, and orphaned data compound quietly — driving up compute and storage cost while query latency drifts upward.

Per-engine scripts that don't scale

Spark, Trino, Athena, Snowflake optimize differently. Teams juggle configs, schedules, and scripts across engines with no coordination.

Metadata & layout drift

Manifests bloat, partitions skew, and data layouts drift from real workloads. Scan efficiency and query planning degrade over time.

No governance at scale

Retention, compaction, and cleanup rules stay manual per-table. No auditable policies, no inheritance, no lake-wide enforcement.

The Full Platform

Healthy tables are the starting point — here's what else you get

Route every query to the cheapest engine. Enforce retention and compaction policies across catalogs. Let AI agents query your lake with guardrails. All from the same control plane that maintains your tables.

Table Health Overview786 tables
566
Healthy
105
Warning
70
Critical
92%
Optimized
TableNSSizeStatus
customer_ordersorders1.24 TBHEALTHY
payment_transactionspayments860 GBWARNING
raw_clickstreamanalytics4.6 TBCRITICAL
product_catalogproducts42 GBHEALTHY
user_sessionsanalytics1.9 TBWARNING
inventory_levelsoperations320 GBHEALTHY
shipping_eventslogistics580 GBHEALTHY
search_query_logsanalytics3.2 TBCRITICAL

Observability

Learns from query patterns and table signals to decide what to optimize, when, and how — no schedules, no manual tuning.

  • Closed-loop sense → plan → execute → learn
  • Zero manual scheduling or threshold tuning
  • Adapts to workload changes in real time

Production benchmarks

5.5 TB compacted across production tables

Real compaction results on batch, streaming, delete-heavy, and multi-writer Iceberg tables — same Rust engine, same hardware.

101K → 19K
Files after compaction (81%)
2,522 MB/s
Peak compaction throughput
95%
Faster than Spark compaction
Faster queries after compaction
TableSizeWorkloadFiles (B → A)ThroughputTime
balance_snapshots1,192 GBTB-Scale batch11,9573,2701,572 MB/s11 min
events_analytics484 GBDelete-Heavy16,1287,198729 MB/s11m 21s
raw_sdk_events8 GBStreaming42,63369167 MB/s138s
site_traffic292 GBMulti-Writer2,7407541,465 MB/s3m 25s

Compaction speed

200 GB benchmark (seconds)

LakeOps221s
Spark1,612s

95% faster

Cost per TB

Normalized to Spark = 100%

LakeOps$5/TB
Spark$50/TB

90% cheaper

Query time

Avg. query latency after compaction

After1.5s
Before12.1s

8x faster queries

Connect in minutes
- no vendor lock-in

1

Connect catalogs & engines

Only metadata is processed — never retained or stored.

Apache Iceberg
AWS
Snowflake
DuckDB
2

Get visibility & insights

Telemetry reveals table health and actions needed.

Table health scores
Optimization opportunities
Cost & performance insights
3

Choose your mode

Autopilot, manual approval, or policy-driven.

Autopilot
Manual
Policies
4

Lakehouse optimized

Queries 10x faster
Cost down 76%
Engines optimized
AIs managed
Tables healthy
Fully governed
Set up in 10 minutes · Works with your existing stack

Resources

Learn more

Explore all articles

Connect a catalog. Tables start getting maintained.

No Spark jobs to write. See compaction, expiry, and cleanup on your own tables.