
AI agents are becoming first-class consumers of lakehouse data. An analyst copilot answering natural-language questions. A customer-facing chatbot pulling real-time order status. An on-call assistant triaging table health at 2 AM. An ML pipeline agent discovering features across hundreds of tables.
These agents don't query like humans. They issue dozens of SQL statements per reasoning step, iterate without supervision, and access tables they've never seen before. Yet most teams still connect them the same way they'd connect a BI dashboard — a JDBC string and a prayer.
The result is predictable: hallucinated table names, runaway scans on petabyte tables, zero visibility into table health, and no guardrails against destructive operations. The data-access bottleneck isn't about permission — it's about the absence of a structured, agent-native interface between AI and your Iceberg metadata.
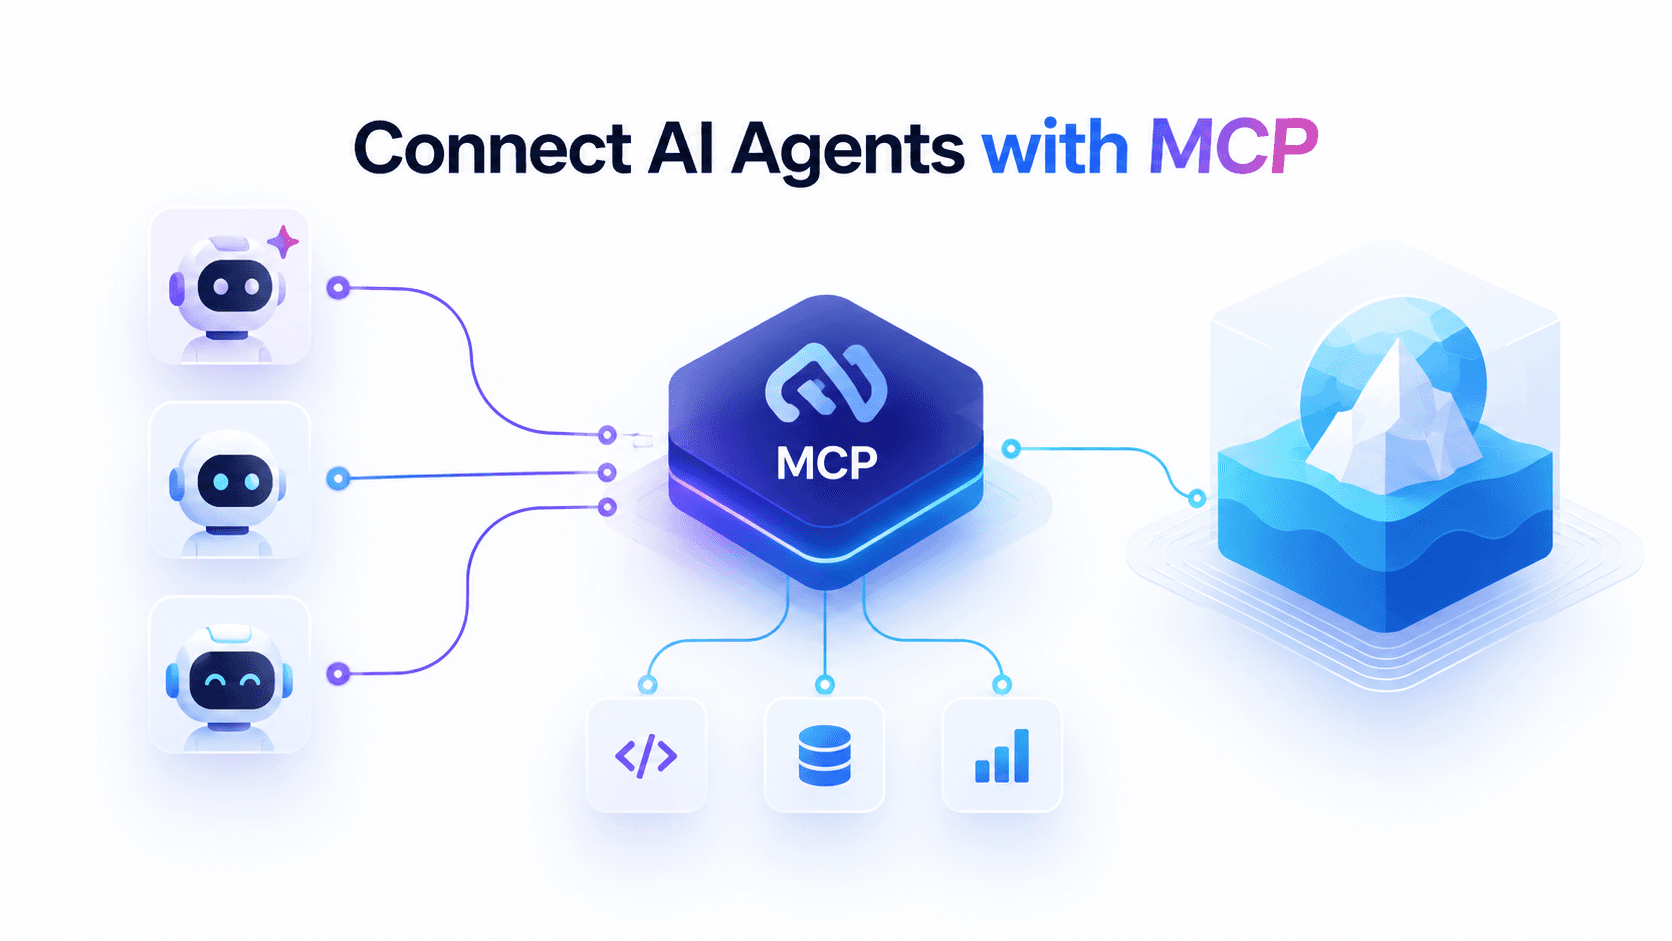
This guide walks through how to solve that problem using the Model Context Protocol (MCP) — the open standard for agent-to-tool connectivity — and shows you step by step how to connect AI agents to your Apache Iceberg lakehouse using the LakeOps MCP server.
The short version: LakeOps is an autonomous control plane for Iceberg lakehouses. Instead of building custom integrations between your AI agents and Iceberg catalogs, you use LakeOps as the bridge — it provides an MCP server with 27 purpose-built tools that give agents structured access to your entire lakehouse through a standard protocol. Connect once, and every agent in your org inherits catalog discovery, table health diagnostics, maintenance signals, query routing, and guardrails. No glue code, no per-agent configuration, no custom SDK.
The Data-Access Bottleneck: Why Agents Can't Just Use SQL
Here's a question that will break most AI agents: "Why is my customer_orders table slow, and what should I do about it?"
A platform engineer would check the small-file count (940 files, most under 8 MB from streaming ingestion), notice 847 snapshots pinning 1.2 TB of dead storage, see that manifests have fragmented to 12× the optimal count, and know the fix is compaction first, then snapshot expiry, then manifest rewrite — in that order, because reversing the sequence wastes compute. This entire diagnosis lives in Iceberg metadata. None of it requires reading a single data row.
An agent with only SQL access? It'll SELECT COUNT(*) FROM customer_orders, confirm the table has records, and tell you everything looks fine. It has no visibility into the metadata layer where the actual problem lives.
What You'd Build Yourself
Before MCP, connecting an agent to an Iceberg lake meant one of three painful paths:
- Custom API wrappers — Build REST endpoints for health metrics, write glue code for each agent framework (LangChain, CrewAI, LlamaIndex), update everything when you add a tool or change a response shape. Works for a demo; collapses at 20+ tools across a team.
- Direct SQL access — Hand the agent a connection string and hope it doesn't
SELECT *on a 2 TB table. No schema discovery, no health awareness, no maintenance capabilities. In testing, agents given a generic SQL endpoint skip schema discovery calls more than 70% of the time. - Copy-paste context — Screenshot the dashboard, paste it into chat, ask the agent to interpret stale data. Scales to exactly one incident before the engineer gives up.
The fundamental issue: Iceberg's operational layer — file distributions, snapshot accumulation, manifest bloat, partition skew — is invisible to SQL. And the maintenance operations that fix these problems (compaction, snapshot expiry, orphan cleanup) aren't SQL operations at all. They're control-plane operations. Agents need a control-plane interface.
What Is MCP (Model Context Protocol)?
The Model Context Protocol is an open standard that defines how AI agents discover, invoke, and receive results from external tools. Think of it as what REST APIs did for web services or JDBC did for database access — but purpose-built for the agent era.
MCP defines three primitives:
- Tools — Functions agents can call, with typed schemas and natural-language descriptions
- Prompts — Pre-built workflows agents can follow
- Resources — Data sources agents can read
Each tool carries annotations like readOnlyHint and destructiveHint that tell clients whether an operation reads data or modifies it. MCP clients like Cursor and Claude Desktop use these hints to prompt for confirmation before agents trigger dangerous operations.
The protocol has rapidly become the standard for agent-to-tool connectivity. Every major AI framework — Claude, LangChain, LlamaIndex, Cursor, GitHub Copilot — supports MCP natively. The 2026-07-28 spec revision made the protocol fully stateless, removing session management entirely so MCP servers can scale behind standard load balancers. Configure your client once, and every agent inherits the same tool surface, authentication, and permission scopes. Add a new tool on the server, and every connected agent discovers it automatically.
For Iceberg specifically, MCP fills a gap that REST catalogs were never designed to cover:
| Layer | Protocol | Consumer | Purpose |
|---|---|---|---|
| Catalog | Iceberg REST / Glue / Hive | Query engines | Table discovery, snapshot commits, schema evolution |
| Control plane | MCP (Streamable HTTP) | AI agents | Health inspection, maintenance decisions, policy management |
| Query | SQL / Arrow Flight / Postgres wire | Engines and agents | Data retrieval with routing and guardrails |
REST catalogs tell engines where tables live and how to commit changes. MCP tells agents which tables are healthy, which are degrading, what to do about it, and whether the last fix worked. Different consumers, different questions, complementary protocols.
Architecture: How AI Agents Connect to Iceberg via MCP
The connection architecture has five layers. The critical insight is that a control plane sits between agents and your catalogs — agents never talk directly to Iceberg metadata or query engines.
1┌─────────────────────────────────────────────────────────────┐2│ AI AGENTS │3│ Claude · Cursor · LangChain · LlamaIndex · Custom │4└──────────────────────────┬──────────────────────────────────┘5 │ MCP Protocol (Streamable HTTP)6 │ Bearer token auth per region7 ▼8┌─────────────────────────────────────────────────────────────┐9│ LAKEOPS CONTROL PLANE │10│ │11│ ┌──────────┐ ┌───────────┐ ┌──────────┐ ┌───────────┐ │12│ │ 27 MCP │ │ Guardrails│ │ Query │ │ Autonomous│ │13│ │ Tools │ │ ReadOnly │ │ Routing │ │ Table │ │14│ │ Discovery│ │ CostEst │ │ Adaptive │ │ Maintenanc│ │15│ │ Analysis │ │ PIIMask │ │ LLM │ │ Compaction│ │16│ │ Governanc│ │ HumanAppr │ │ Semantic │ │ Expiry │ │17│ └──────────┘ └───────────┘ └──────────┘ └───────────┘ │18│ │19│ Metadata only — your data stays in your account │20└──────────────────────────┬──────────────────────────────────┘21 │ Iceberg REST / Glue / Nessie API22 ▼23┌─────────────────────────────────────────────────────────────┐24│ ICEBERG CATALOGS │25│ AWS Glue · REST/Polaris · Nessie · S3 Tables · Gravitino │26└──────────────────────────┬──────────────────────────────────┘27 │28 ▼29┌─────────────────────────────────────────────────────────────┐30│ OBJECT STORAGE │31│ S3 · GCS · ADLS — Parquet files in your account │32└─────────────────────────────────────────────────────────────┘LakeOps reads Iceberg metadata directly from catalogs and presents a single, engine-agnostic tool surface. The agent calls search_tables, filters by status=CRITICAL, and gets consistent health data regardless of which engine wrote the data or which catalog hosts it. Your data never leaves your account — LakeOps processes only metadata.
Why a Control Plane Instead of Direct Access
Without a control plane, connecting agents to Iceberg means building and maintaining every layer yourself:
| What you need | DIY approach | With LakeOps |
|---|---|---|
| Tool interface | Build custom MCP tools for each catalog, maintain schemas, handle versioning | 27 tools auto-discovered by any MCP client |
| Schema discovery | Query engine-specific system tables, handle dialect differences | list_catalogs → search_tables → get_schema |
| Health diagnostics | Write monitoring scripts, define thresholds, parse raw metadata JSON | get_table_insights returns typed insight objects with severity and recommendations |
| Maintenance sequencing | Encode compaction-before-expiry logic, handle dependencies | analyze_table_maintenance embeds sequencing rules |
| Guardrails | Build SQL parsers, cost estimators, PII detectors per engine | Four stackable guards: ReadOnly, CostEstimate, PIIMask, HumanApproval |
| Multi-engine routing | Implement dialect translation, track engine performance, build caching | Three-router stack: Adaptive, LLM, Semantic — 0ms cached decisions |
| Multi-catalog support | Separate integration per catalog type | Unified surface across Glue, Polaris, Nessie, S3 Tables, Gravitino |
| Observability | Aggregate logs across engines, correlate with agent sessions | Per-agent metrics, cost attribution, full audit trail |
The control plane approach collapses months of integration work into a 10-minute setup.
Step-by-Step: Set Up the LakeOps MCP Server
Connecting takes two steps. The full MCP server setup documentation includes a region picker that fills in the correct URL for your organization.
Step 1: Create a Scoped API Key
In the LakeOps dashboard, navigate to Organization → API Keys. Create one key per region your organization uses. Select the permission scopes your agent needs:
| Scope | Grants |
|---|---|
read | All discovery and analysis tools — lake health, table insights, maintenance signals (21 tools) |
write | Policy management — create, update, enable/disable, execute policies |
catalogs:read | List and inspect catalogs |
tables:read | Browse, search, inspect tables (schema, metadata, partitions) |
query:read | Execute SQL queries through the routing layer |
policies:write | Create and manage governance policies |
Start with read scope — it covers all 21 discovery and analysis tools. Add write when you're ready for policy management.
Important: Scopes are independent. write does not include read. Agents that discover data and manage policies need both. A policies:write-only key can create policies but cannot call search_tables or any analysis tool.
Copy each key immediately — it's shown only once.
Step 2: Configure Your MCP Client
Drop one JSON block into your client's config file. Here are the configs for the most common setups:
Cursor — add to .cursor/mcp.json in your project root:
1{2 "mcpServers": {3 "lakeops-us-east-1": {4 "url": "https://api.lakeops.dev/mcp",5 "headers": {6 "Authorization": "Bearer <your-api-key-us-east-1>"7 }8 }9 }10}Claude Desktop — add to claude_desktop_config.json:
1{2 "mcpServers": {3 "lakeops-us-east-1": {4 "url": "https://api.lakeops.dev/mcp",5 "headers": {6 "Authorization": "Bearer <your-api-key-us-east-1>"7 }8 }9 }10}Multi-region setup — for organizations spanning regions:
1{2 "mcpServers": {3 "lakeops-us-east-1": {4 "url": "https://api.lakeops.dev/mcp",5 "headers": {6 "Authorization": "Bearer <your-api-key-us-east-1>"7 }8 },9 "lakeops-eu-west-1": {10 "url": "https://api-eu.lakeops.dev/mcp",11 "headers": {12 "Authorization": "Bearer <your-api-key-eu-west-1>"13 }14 },15 "lakeops-ap-south-1": {16 "url": "https://api-in.lakeops.dev/mcp",17 "headers": {18 "Authorization": "Bearer <your-api-key-ap-south-1>"19 }20 }21 }22}Available regions:
| Region | Endpoint |
|---|---|
| 🇺🇸 US East (N. Virginia) | https://api.lakeops.dev/mcp |
| 🇮🇪 EU West (Ireland) | https://api-eu.lakeops.dev/mcp |
| 🇮🇳 Asia Pacific (Mumbai) | https://api-in.lakeops.dev/mcp |
Step 3: Enable and Verify
In Cursor, go to Settings → MCP and enable the server. In Claude Desktop, restart the app. Your agent now auto-discovers all 27 tools.
Test the connection by asking your agent: "List all my Iceberg catalogs." The agent should call list_catalogs and return catalog names, table counts, and total sizes. If you see empty results, check the troubleshooting section below.
> Common gotcha: A region mismatch is the #1 setup issue. An API key created for a Mumbai org against the US endpoint returns empty catalogs with no obvious error. Match the endpoint host to your organization's data region.
The 27 MCP Tools: What Your Agent Can Do
The LakeOps MCP server exposes 27 tools organized into four categories. Agents auto-discover them via the standard MCP tool listing — no manual registration required.
Discovery & Read (15 tools)
These tools give agents structured access to your entire lake — catalogs, tables, schemas, health status, and maintenance signals. They replace the dozens of engine-specific queries you'd otherwise need to build tool wrappers for.
| Tool | What It Does |
|---|---|
list_catalogs | Enumerate all registered Iceberg catalogs with table counts and total size. Start here. |
list_namespaces | List namespaces in a catalog with optional query filter. |
search_tables | Search and filter tables by name, catalog, namespace, or health status. The query argument is optional — filter by catalog and status alone to find all CRITICAL tables. |
get_table_details | Size, record count, delete files, health status for one table. |
get_schema | Current column layout: names, types, partition_by, sort_by. Prefer this over get_table_metadata when you only need structure. |
get_table_metadata | Full Iceberg metadata plus ai_context block (schema, partition spec, sort order, snapshot stats). Use for deep dives. |
get_table_insights | Typed insight objects explaining why a table is WARNING or CRITICAL — with severity, metrics, and recommendations. |
get_maintenance_signals | Adaptive signals: needs_compaction, needs_expire_snapshots, normalized scores, accumulation rates, projected trigger times. |
get_table_profile | Combined stats + insights + signals + health_signals[] in one call. Prefer this over calling the three above individually. |
get_partition_distribution | Per-partition file counts, sizes, delete ratios, and histograms. Supports pagination and search. |
get_hot_partitions | Top partitions by file count with skew_signal when the hottest partition exceeds 10× the average. |
get_table_scan_cost_hints | Full-scan cost signals before recommending an expensive operation. |
get_table_events | Operation history: compaction, expiry, cleanup with per-event impact metrics and durations. |
get_lake_health | Org-wide 30-day health dashboard: tables, storage reclaimed, health breakdown across catalogs. |
list_policies | All governance policies with status, scope, and type filters. |
This layered discovery prevents the most common agent failure mode: hallucinated table names. When schema discovery is a separate tool call with structured output, agents call it first. When discovery is buried inside a generic SQL endpoint, agents skip it and guess.
Analysis Workflows (7 tools)
Analysis tools preload live data and return { title, instructions } — structured guidance the agent follows. They encode expert knowledge directly into the tool layer, so every agent benefits from the same operational reasoning without elaborate system prompts.
| Tool | What It Does |
|---|---|
analyze_table_health | Quick health check with stats, insights, and recent events. |
analyze_table_maintenance | Full maintenance decision: profile, policies, last 20 events, actionable recommendations including do-nothing when maintenance cost exceeds benefit. |
analyze_storage_reclaim | Largest tables and snapshot-bloat insights for prioritized cleanup. |
analyze_compaction | Tables with small-file and high-delete problems, with compaction plans. |
analyze_lake_health | Executive summary of 30-day lake-wide metrics. |
analyze_critical_triage | Ranked on-call priorities across the lake. |
analyze_policy_gaps | Missing or misconfigured governance policies across your catalogs. |
Why this matters: analyze_table_maintenance encodes sequencing logic that most agents can't infer. It knows that compaction should precede manifest rewriting (because compaction changes the file set), and that snapshot expiry should precede orphan cleanup (because expiry marks files as unreferenced). Instead of expecting every agent to know these rules, the tool embeds them and returns ordered recommendations with concrete metrics.
Governance (5 tools)
| Tool | What It Does |
|---|---|
create_policy | Create a governance policy (compaction, snapshot expiry, orphan cleanup, adaptive maintenance). |
update_policy | Update an existing policy by ID. |
enable_policy / disable_policy | Toggle policies without deleting them. |
execute_policy | Trigger immediate execution. Marked destructiveHint — clients prompt for confirmation. |
Safety note: Only execute_policy carries destructiveHint. Other write tools create or update policy definitions but don't run maintenance directly. The agent proposes, the human approves — MCP's tool annotations make this workflow native.
Agent Guardrails: Safe, Unsupervised Operation
Giving agents SQL access without guardrails is a compliance and cost incident waiting to happen. A research agent exploring an unfamiliar dataset will happily run SELECT * FROM events on a 4 TB table. A coding agent asked to "clean up old data" will issue DELETE statements against production. A support agent will return email addresses and SSNs in plain text — straight into the LLM context window.
LakeOps provides four composable guardrails that sit between the agent and the query engine. You configure them per routing group, per team, or globally — not per agent.
| Guardrail | What It Does | DIY alternative |
|---|---|---|
| ReadOnly | Blocks DDL and DML (INSERT, UPDATE, DELETE, DROP, CREATE, ALTER) from agent sessions. Uses SQL parsing via sqlparser-rs, not string matching — catches CTEs wrapping mutations and function calls with side effects. | Build your own SQL parser per engine dialect. |
| CostEstimate | Runs EXPLAIN before execution and rejects queries exceeding a scan threshold. Prevents an agent from accidentally scanning petabytes. | Implement EXPLAIN parsing for each engine. Some engines (Athena) don't return structured cost estimates. |
| PIIMask | Hashes or redacts sensitive columns (email, SSN, phone) before results reach the model. Three strategies: exclude (remove column), hash (SHA256 pseudonym), or null-out. PII never enters the LLM context window — a GDPR/CCPA requirement. | Build column-level rewriting per engine dialect. Maintain a sensitive-column registry. |
| HumanApproval | Pauses high-impact operations and sends a notification (Slack, email) for human review before execution. Configurable timeout: auto-reject, auto-approve, or queue indefinitely. | Build webhook integrations, approval UIs, timeout handling. |
Guardrails are stackable — enable the ones that match your security requirements. A typical agent-facing configuration runs: ReadOnly → CostEstimate → PIIMask. Every fired guard is logged with the full query context for audit.
For a deeper look at building AI-ready Iceberg infrastructure, see the agentic AI enablement guide.
Multi-Catalog Support: Connect Once, Access All Catalogs
Production Iceberg deployments rarely use a single catalog. One team uses Glue, another runs Polaris, a third is migrating to Nessie. Without a control plane, you'd build separate MCP tool wrappers for each catalog type — different APIs, different metadata formats, different health check logic.
LakeOps connects to all major catalog types and presents a unified tool surface across them:
- AWS Glue — The most common catalog for AWS-native deployments
- Iceberg REST Catalog — The open standard (Polaris, Lakekeeper, Gravitino)
- Apache Polaris — Snowflake's open-source REST catalog implementation
- Nessie — Git-like versioning for Iceberg tables
- S3 Tables — AWS's managed Iceberg experience
- Gravitino — Apache's unified metadata lake
When an agent calls list_catalogs, it sees every connected catalog with table counts and total size. search_tables searches across all catalogs simultaneously. An agent diagnosing a CRITICAL table doesn't need to know whether it lives in Glue or Polaris — the tool surface is identical.
The LakeOps platform reads Iceberg metadata directly from catalogs and provides consistent health scores, maintenance signals, and policy management regardless of the underlying catalog implementation.
Multi-Engine Query Routing for Agent Traffic
Agents don't just read metadata — they run SQL. And the wrong engine choice at agent scale is expensive. A simple metadata lookup that costs $0.001 on DuckDB costs $0.05 on Snowflake. Across thousands of agent queries per day, that's the difference between a viable AI investment and a runaway cloud bill.
Without routing, you'd need to configure each agent with engine-specific connection strings, handle SQL dialect translation yourself, and hope agents pick the right engine for each query shape.
LakeOps routes agent SQL through QueryFlux — an open-source, Rust-based SQL proxy with ~0.35ms P50 overhead — to the cheapest viable engine. Agents connect via standard Postgres, MySQL, or Arrow Flight protocols. The routing layer handles dialect translation automatically.
Three router types handle different traffic:
- 1.Adaptive — Pure statistics over query history. Handles ~80% of agent traffic (repeated templates) at 0ms decision cost.
- 2.LLM — For novel query shapes. Uses a language model to reason about optimal placement, then caches the decision for every future execution of the same template shape.
- 3.Semantic — Embedding similarity against known query shapes. Handles the long tail of rare patterns at ~1ms decision cost.
The result: per-query compute cost drops 60–70% on typical agent workloads. An agent issuing 50 queries per interaction at $0.05 each on a mis-routed engine costs $2.50 per interaction. Routed optimally, the same interaction costs $0.15. At 1,000 interactions per day, that's $2,350 saved daily.
What an Agent Triage Session Actually Looks Like
To make this concrete, here's what happens when a platform engineer opens Cursor and asks: "Which tables need attention right now?"
Step 1 — Discovery. The agent calls search_tables with status=CRITICAL, sorted by size descending. It receives structured JSON — catalog, namespace, name, size, record count, health status for each table. No hallucinated names, no guessing.
1Agent → search_tables(status="CRITICAL", sort="tableSizeInBytes", order="desc")2 3Response:4 analytics.events.page_views 4.2 TB CRITICAL5 ecommerce.orders.customer_orders 1.24 TB CRITICAL6 marketing.events.raw_clickstream 3.2 TB CRITICALStep 2 — Deep diagnosis. For the top table, the agent calls get_table_profile. One call returns:
- File health: 940 small files (avg 7 MB), 6.2 GB compactable
- Delete pressure: 23 delete files, 8% delete ratio in
region=us-east-1partition - Snapshot bloat: 847 snapshots, 820 expirable, 1.2 TB reclaimable storage
- Manifest bloat: 340 MB total manifest size, 12× optimal count
- Health signals: Plain-language summaries like "940 small data files (avg 7 MB) — compact to reduce planning time by ~80×"
Step 3 — History. The agent calls get_table_events and sees that the last compaction ran 18 days ago, snapshot expiry has never run, and no governance policies are attached. The trajectory is clear: this table generates small files faster than maintenance is clearing them.
Step 4 — Recommendation. The agent calls analyze_table_maintenance, which returns structured recommendations with concrete metrics:
- Enable
ADAPTIVE_MAINTENANCEfor continuous compaction - Set snapshot retention to 10 with a 7-day age window
- Defer orphan cleanup until after expiry is established (because expiry must mark files as unreferenced first)
Step 5 — Action. If the engineer says "go ahead," a write-scoped agent calls create_policy. The destructiveHint on execute_policy means Cursor prompts for confirmation before triggering execution — the agent proposes, the human approves.
Five structured tool calls. From lake-wide triage to metrics-backed remediation in under a minute. Without LakeOps, this same workflow would require opening a monitoring dashboard, SSH-ing into a bastion, running diagnostic queries against three different engines, manually computing health thresholds, and writing a remediation runbook. That's 30+ minutes of manual work — per table.
Authentication, Security, and Tenant Isolation
Every MCP request passes through the same authentication layer as the LakeOps REST API:
- API key auth — Bearer token in the
Authorizationheader, bound to your organization and data region - Tenant isolation — Agents can only see and act on your tenant's data. Cross-tenant access is architecturally impossible; tenant context derives from the key, not from agent input
- Scope enforcement — Calls without the required scope return an explicit error naming the missing permission (e.g.,
scope 'policies:write' required) - Unauthenticated/invalid requests — Rejected with 401 before reaching any tool
For enterprise deployments, LakeOps supports SOC 2 Type II compliance, SSO/RBAC, encryption, and full audit trails. Every tool call, every guard action, every policy execution is logged with agent identity, conversation context, and execution details.
Troubleshooting Common Setup Issues
| Symptom | Fix |
|---|---|
| 401 Unauthorized | Check the API key is valid for that region's endpoint and the Authorization header uses Bearer prefix. |
scope required error | The key is missing the scope for that tool. Create a new key with the required permissions. Remember: write does not include read. |
no tenant context error | The key is not associated with an organization. Ensure it was created from an org context. |
| Tools not appearing in client | Enable each server in Cursor Settings → MCP. URLs must end in /mcp. |
| Agent calls wrong region | With multiple servers, tell the agent which MCP server to use (e.g., lakeops-us-east-1) or disable regions you don't need. |
| Empty catalogs or no tables | Likely a region mismatch. Keys for US East orgs must use api.lakeops.dev, not api-in.lakeops.dev. |
Read tools fail with scope required | The key has write scope only. Add read scope — they're independent. |
The Closed Loop: Agents Make Your Lake Faster
Here's what makes this architecture powerful beyond point-in-time access: it forms a feedback loop.
1 ┌──────────────┐2 │ Agents query │──── access patterns feed into ────┐3 │ via MCP │ │4 └──────┬───────┘ ▼5 │ ┌──────────────────────┐6 │ │ Compaction adapts │7 │ │ Sort orders align to │8 │ │ agent filter columns │9 │ └──────────┬───────────┘10 │ │11 ▼ ▼12 ┌──────────────┐ ┌──────────────────────┐13 │ Faster tables │◄────────────────────│ More engines become │14 │ Lower latency │ │ viable per query │15 └──────────────┘ └──────────────────────┘Agent query patterns feed back into every optimization. The columns agents filter on inform compaction sort orders. Tables with heavy agent traffic get compacted more frequently. Snapshot expiry, orphan cleanup, and manifest rewrites adapt to access patterns. As storage optimizes for agent patterns, more engines become viable for each query shape — a query that required Trino before compaction might run on DuckDB afterward, cutting cost by 8×.
The lake gets faster the more agents use it. LakeOps handles this optimization autonomously using a Rust/DataFusion compaction engine — 95% faster and 90% cheaper than Spark. No cron jobs, no Airflow DAGs. Health-driven triggers run maintenance when tables need it, not on fixed schedules.
For the full picture of how this works in practice, see Iceberg Lakehouse with AI Agents and the deep dive on MCP for Apache Iceberg.
Getting Started
- 1.Sign up at lakeops.dev and connect your Iceberg catalogs. Setup takes about 10 minutes. No agents to install, no data to move.
- 1.Get your tables healthy. Enable continuous compaction and snapshot expiry. An agent hitting a table with 200,000 small files will time out regardless of how good the MCP interface is. This is a prerequisite, not an optimization. Read more about managed lakehouse operations.
- 1.Create a read-scoped API key and drop the MCP config into your
.cursor/mcp.jsonorclaude_desktop_config.json. Verify the connection by asking your agent to list catalogs.
- 1.Start with analysis tools. Ask your agent to triage CRITICAL tables or summarize lake health. You'll get structured, metrics-backed answers in seconds that would take 30 minutes of dashboard clicking to assemble manually.
- 1.Add write scope when ready. Once you trust the recommendations, enable policy management so agents can propose and create governance policies with human approval on destructive operations.
The lakehouse stack now has three standard interfaces: object storage for data files, REST catalogs for query engines, and MCP for AI agents. The agents that succeed in production won't be the ones with the most elaborate system prompts — they'll be the ones connected to structured, scoped, purpose-built tools that encode the operational knowledge no model can infer from training data alone.