






Managed Iceberg in 2026: Autonomous Data Lake
Iceberg tables degrade silently — small files pile up, snapshots bloat metadata, and query latency creeps higher. A breakdown of the nine components every production data lake needs to stay healthy.
Managed Lakehouse
LakeOps manages your entire Iceberg lakehouse — compaction, maintenance, cost optimization, query routing, observability, governance, and AI-agent readiness. One control plane across every engine, catalog, and cloud. No code changes, no vendor lock-in.
Platform Preview
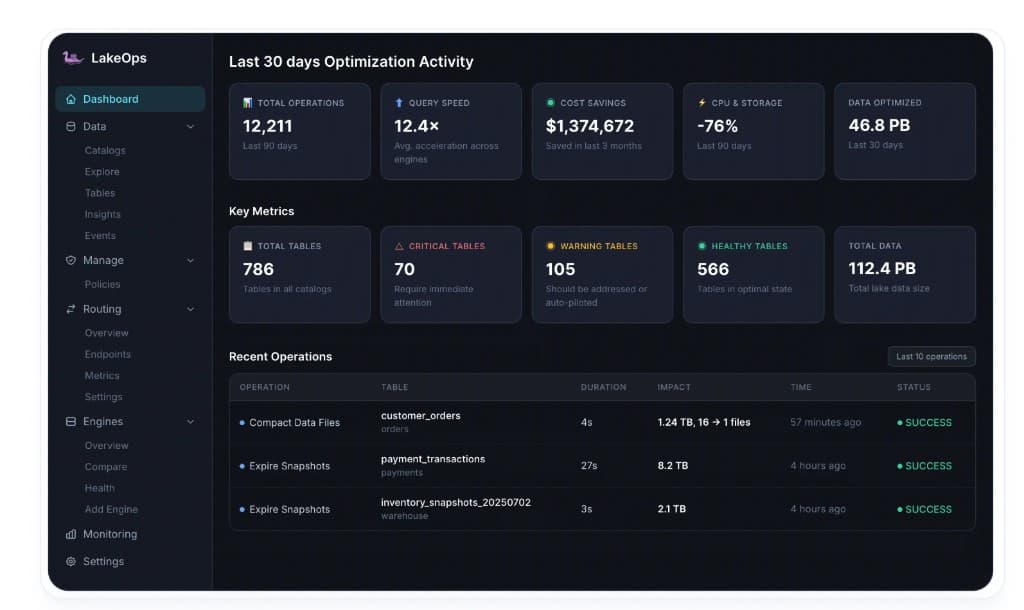
Explore how LakeOps manages maintenance, compaction, routing, and observability from a single interface — across every engine and catalog.
| Operation | Table | Duration | Impact | Time | Status |
|---|---|---|---|---|---|
| Compact Data Files | customer_orders orders | 4s | 1.24 TB, 16 → 1 files | 57 minutes ago | SUCCESS |
| Expire Snapshots | payment_transactions payments | 27s | 8.2 TB | 4 hours ago | SUCCESS |
| Expire Snapshots | inventory_snapshots_20250702 warehouse | 3s | 2.1 TB | 4 hours ago | SUCCESS |
| Rewrite Manifests | raw_clickstream analytics | 1.9s | 3 → 1 manifests | 5 hours ago | SUCCESS |
| Compact Data Files | product_catalog products | 6m 11.3s | 3,008 → 1,256 files | 6 hours ago | SUCCESS |
The Problem
Without active management, Iceberg tables degrade silently — and every query across every engine pays the price.
Streaming creates thousands of tiny files — each costs an S3 GET, a metadata read, and a planner entry.
Without query-aware sort, predicate pushdown fails — engines scan every row group regardless of filters.
Hundreds of manifests and stale snapshots accumulate. Query planning time grows from milliseconds to seconds.
Unreferenced objects and position delete files pile up — inflating storage and adding read-time overhead.
Multiple engines read the same tables but telemetry is siloed — no unified view of table health, costs, or performance.
Without routing, every query lands on one engine — dashboards wait behind ETL, and scan-priced queries waste compute.
Retention, compaction, and access rules stay manual per-table — no auditable, catalog-wide governance.
AI pipelines need fast, consistent, well-structured tables — unmaintained lakes break agent queries silently.
Lakehouse Control Plane
Maintenance, compaction, cost optimization, query routing, observability, governance, and AI readiness — managed autonomously from a single control plane.
The complete control plane — compaction, maintenance, cost optimization, routing, observability, governance, and AI readiness.
Explore platformSnapshot expiration, manifest rewrites, orphan cleanup, and metadata — automated, sequenced, and safe.
Explore maintenanceRust engine, not Spark. Sorts data by real query patterns so reads skip entire file groups. $5/TB vs $50.
Explore compactionRoute queries across Trino, Spark, Snowflake, and more — optimized for cost, latency, or throughput per workload.
Explore routingTable health, insights, cross-engine telemetry, policies, retention, and audit trails — one control plane.
Explore observabilityAgent-native MCP interface, guardrails, and a self-optimizing lake ready for AI agents and autonomous pipelines.
Explore AI enablementRuns on your stack
10 minutes to value
LakeOps connects to your existing catalogs and engines — no infra changes, no migrations. Policies run autonomously from day one. See the impact on your own tables in a live walkthrough.
Resources

Iceberg tables degrade silently — small files pile up, snapshots bloat metadata, and query latency creeps higher. A breakdown of the nine components every production data lake needs to stay healthy.

Netflix spent years building an intelligent lakehouse — Polaris, Autotune, janitors, and Metacat. LakeOps lets every team build the same — and go beyond — in minutes.

How to route queries across Trino, Spark, DuckDB, Snowflake, Athena, and Flink on shared Iceberg tables — SQL routing proxy, dialect translation, and table-aware optimization.
“LakeOps took the pain out of compaction and maintenance. We went from ad-hoc scripts and firefighting to a single control plane. Query performance improved and our platform team finally has visibility across the lake.”

Production benchmarks
Real workloads. Real data. Batch, streaming, delete-heavy, multi-writer, and terabyte-scale tables — all on the same engine, same hardware.
| Table | Size | Workload | Files (B → A) | Throughput | Time | Notes |
|---|---|---|---|---|---|---|
| balance_snapshots | 1,192 GB | TB-Scale batch | 11,957 → 3,270 | 1,572 MB/s | 11 min | Spark OOM on same hardware |
| user_accounts | 174 GB | Batch | 878 → 400 | 2,269 MB/s | 74s | Single Node |
| events_analytics | 484 GB | Delete-Heavy | 16,128 → 7,198 | 729 MB/s | 11m 21s | 23,433 delete files; 551M rows removed |
| raw_sdk_events | 8 GB | Streaming | 42,633 → 69 | 167 MB/s | 138s | 99.8% file reduction |
| site_traffic | 292 GB | Multi-Writer | 2,740 → 754 | 1,465 MB/s | 3m 25s | Single partition |
| cluster_registry | 322 GB | Batch | 998 → 440 | 2,522 MB/s | 2m | Peak throughput |
Normalized to Spark = 100%
Source: 200 GB (~1 TB uncompressed) benchmark. Spark cost index 100 vs LakeOps 10.
balance_snapshots — 1.192 TB across consecutive runs
Same data and hardware; planner learns workload telemetry and improves runtime from 22 to 11 minutes.