Sort orders adapt, routing improves, cadence tunes every run.
Open and runs on your stack
1Observe — see what's degrading your lake
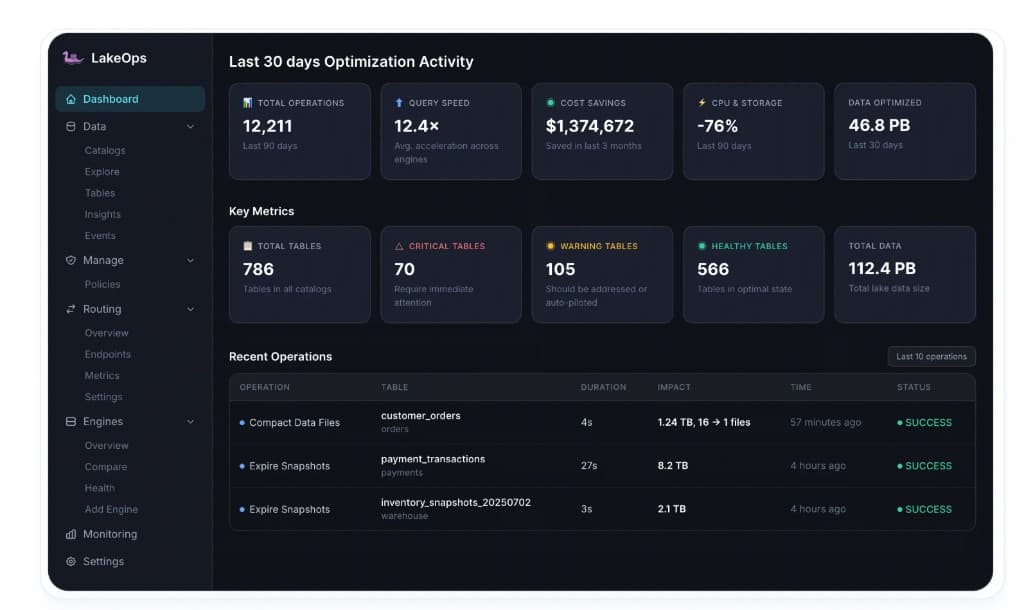
Table Health Overview786 tables
566
Healthy
105
Warning
70
Critical
92%
Optimized
Table
NS
Size
Status
customer_orders
orders
1.24 TB
HEALTHY
payment_transactions
payments
860 GB
WARNING
raw_clickstream
analytics
4.6 TB
CRITICAL
product_catalog
products
42 GB
HEALTHY
user_sessions
analytics
1.9 TB
WARNING
inventory_levels
operations
320 GB
HEALTHY
shipping_events
logistics
580 GB
HEALTHY
search_query_logs
analytics
3.2 TB
CRITICAL
Real-time health detection across every Iceberg table
Every table scored as Healthy, Warning, or Critical — based on file count, small-file ratio, snapshot age, manifest bloat, and write velocity. LakeOps surfaces degradation before it reaches your queries, with unified telemetry across every engine in your stack.
Per-table health scores that flag degradation before it hits query performance
Unified telemetry across Trino, Spark, Snowflake, Athena, DuckDB, and Flink
Full operation history with duration, files affected, and bytes reclaimed
2Maintain — keep every table healthy, automatically
customer_ordersMaintenance Health
Autonomous
Compaction Scope— what will be targeted this run
already compacted
38% hot zone
#4,812 baseline#7,104 watermark#8,506 now
Coordinated Operations
execution order →
In Progress
Compaction
72%
38% small files — merging 970 → 87 at 512 MB target
then →Expire Snapshots
Cooling
Expire Snapshots
45%
154 snapshots, 62 past 30-day retention
then →Rewrite Manifests
Idle
Rewrite Manifests
18%
12 manifests — below threshold, waiting for compaction
then →Orphan Cleanup
Idle
Orphan Cleanup
8%
847 MB unreferenced — scheduled after expiration
Learning from telemetry
Query patterns
event_date, region
Top sort columns (Trino + Spark)
Improvement
12.4× faster
Avg query speed after optimization
Cycle
Self-tuning
Sort orders adapt as patterns change
Autonomous Iceberg maintenance triggered by health, not schedules
No cron jobs. No Airflow DAGs. No runbooks. LakeOps scores each table's health, decides which operations to run, and sequences them in dependency order — expiry before compaction, compaction before cleanup. Each step's output is the next step's clean input.
Health-driven triggers — runs when tables need it, not on fixed schedules
Lake-wide event trail — every Iceberg table, every operation
Every compaction, snapshot expiration, orphan cleanup, and manifest rewrite is logged as an event — across all catalogs and namespaces. Filter by table, operation type, or status to trace exactly what happened, when, and what it reclaimed. The same feed powers governance audit trails and compliance evidence for SOC 2 and GDPR.
Cross-catalog visibility — events from every engine and catalog in one timeline
Register your catalogs and every table gets maintained continuously. Streaming tables hourly, batch tables daily, idle tables skipped — cadence adapts to write velocity. The full metadata pipeline runs lake-wide without a single additional ops task.
Scales from 50 to 5,000+ tables — every one scored, maintained, and verified
Most compaction tools merge small files blindly. LakeOps watches which columns your queries actually filter, join, and group on — then physically re-sorts data to match. Engines skip entire file groups via min/max pruning, cutting I/O by up to 90%. Built on Rust and Apache DataFusion: 95% faster and 90% cheaper than Spark-based compaction.
12× faster queries — sort order matches real access patterns, not guesswork
76% less CPU — fewer files scanned, zero Spark clusters required
Self-improving — sort strategy adapts as query patterns evolve
How this table's fields correlate — the foundation for choosing the right layout strategy.
order_id
customer_id
order_status
total_amount
item_ids
created_at
payment_method
discount_pct
02,000,0004,000,0006,000,0008,000,000
SELECTFILTERJOIN Rows
order_date.to.sortKey
hrs: 17 queries
sort: descending
partition: order_date
cluster: customer_id
→ order_status
created_at → is_by_timestamp
Time Range Scan
hrs: 41 queries
SELECT *
FROM orders.customer_orders
WHERE created_at
BETWEEN '2026-01-01'
AND '2026-03-31'
LIMIT 10000
order_contract Policy
hrs: 17 queries
scope:
orders.customer_orders
target_contract:
→ order_frequency
≡ generated
↕ Layout Customization Diff
Analyze layout changes across all selected simulations → highlight what sets differ from baseline.
Simulation
data_rel
Strategy
Avg Size
meta
clusterByOrderDate
customer_id, order_status
order_date (day)
343 MB / file
meta
cluster.order_type.by.status
order_status, payment_method
order_status, payment_method
511 MB / file
layout
cluster.insert-time-line
customer_id, store_id
created_at (hour)
128 MB / file
Test layout changes on branches before production
LakeOps tests layout changes on Iceberg branches before they ever touch production — sort orders, partition strategies, and file targets against real query patterns. Compare scan reduction, file count, and estimated speedup side by side, then apply the winning change with one action.
Every candidate change runs on a branch — production tables stay untouched
Side-by-side results: scan reduction, file count, and query speedup
Promote the winning layout when you're ready — one action, no rewrite risk
Manage maintenance, configuration, and lifecycle policies for your data lakehouse
On
Policy
Type
Next Run
Last Run
Updated
Actions
orders_critical
Compact Files
Apr 25, 2026, 8:12 AM
Apr 25, 2026, 03:05 AM
Feb 01, 2025, 3:46 PM
•••
payments_compact
Compact Files
Feb 15, 2026, 12:06 AM
Feb 1, 2025, 02:18 PM
Feb 5, 2025, 4:03 PM
•••
Remove orphan files (e-ip...)
For all tables in all catalogs every 7 days
Orphan Files
Apr 25, 2026, 8:12 AM
Apr 25, 2026, 04:07 PM
Jun 23, 2025, 04:01 PM
•••
clickstream_cdc_events_p
Expire Snapshots
Apr 25, 2026, 12:03 AM
Apr 25, 2026, 03:05 AM
Jan 28, 2025, 03:25 PM
•••
sessions_cdc_events_p
Expire Snapshots
Apr 25, 2026, 12:03 AM
Apr 26, 2026, 03:05 AM
Jun 26, 2025, 11:11 PM
•••
global_expire_snapshots
Runs snapshot expiration on all tables once a day
Expire Snapshots
Apr 26, 2026, 1:18 PM
Apr 07, 2026, 01:08 PM
Mar 14, 2026, 8:42 AM
•••
manifest_rewrite_weekly
Rewrite manifests for all critical tables weekly
Rewrite Manifests
Apr 28, 2026, 2:00 AM
Apr 21, 2026, 02:00 AM
Mar 10, 2026, 9:15 AM
•••
staging_config
Configuration
—
—
Dec 31, 2025, 02:45 PM
•••
Declarative policies that enforce themselves
Compaction thresholds, retention windows, cleanup schedules, sort strategies — set them once as declarative policies. LakeOps enforces them across every catalog and table, continuously. Policies are auditable, versioned, and toggled with one switch. New tables inherit them automatically.
One-toggle policies for compaction, retention, orphan cleanup, and manifests
Scope inheritance — new tables comply from day one
Full audit trail: every execution logged with duration, impact, and outcome
Compare engines side-by-side on cost, latency, throughput, and data scanned.
Select engines
Spark
Active
Trino
Active
Athena
Active
Snowflake
Active
DuckDB
Active
Flink
Active
Performance comparison
Metric
Spark
Trino
Athena
Snowflake
Query success rate
99.2%
99.5%
99.9%
99.8%
Average runtime
3.1s
1.8s
2.3s
2.1s
Cost per query
$0.04
$0.03
$0.05
$0.08
Total queries
3,120
2,456
1,280
1,876
Data scanned
4.2 TB
2.8 TB
1.5 TB
3.5 TB
Cost vs latency
Lower-left is ideal
Low cost
High cost
Success rate
Spark
99.2%
Trino
99.5%
Athena
99.9%
Snowflake
99.8%
One SQL endpoint — queries route to the optimal engine
Your applications connect to a single SQL endpoint. LakeOps routes each query to Trino, Spark, Snowflake, Athena, DuckDB, or Flink — picking the best engine by cost, latency, or workload type. Add or remove engines without touching application code.
Route by cost, latency, or workload type — configured per routing group
Side-by-side engine benchmarks on identical queries
Swap engines behind a stable endpoint — zero application changes
get_optimization_statusreadCompaction + manifest state
Layered guardrails
ReadOnly
Blocks DDL and DML from agent sessions
CostEstimate
Rejects queries exceeding scan thresholds
PIIMask
Hashes sensitive columns before results reach the model
HumanApproval
Pauses high-stakes operations for review
Agent query telemetry feeds back into compaction and sort-order decisions
AI-ready lakehouse — agents query with guardrails
AI agents connect via MCP with standard Postgres, MySQL, or Arrow Flight protocols — no SDK needed. Automate pipelines and CI/CD via the REST API. LakeOps routes agent queries through the same engine pool, enforces guardrails (read-only mode, cost caps, PII masking, human approval), and feeds access patterns back into compaction decisions.
Standard wire protocols — agents connect with any Postgres or MySQL driver
Layered guardrails: ReadOnly, CostEstimate, PIIMask, HumanApproval per session
Closed-loop: agent query patterns inform sort order and compaction priorities
REST API for automation, MCP server for AI agents — full docs for both