





Cost Optimization

Cut Lakehouse Costs by 76%

Query-aware layout, storage cleanup, Rust compaction, engine routing, and autonomous operations — five levers that compound.

Query speed

12×faster

After compaction + layout optimization

CPU reduction

76%less compute

Compute hours across all engines

Storage saved

56%reclaimed

Orphans, snapshots & bloat removed

Table health

100%healthy

Autonomous maintenance keeps every table optimized

TPC-DS benchmark suiteProduction Iceberg tablesMulti-cloud, multi-engine
LakeOps LogoLakeOps

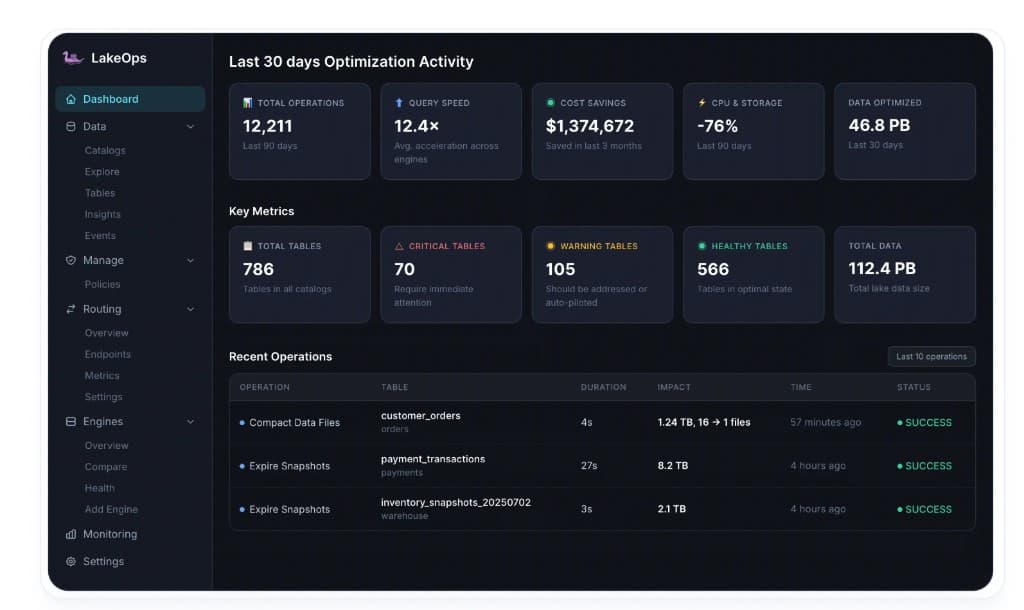
Last 30 days Optimization Activity

Total Operations
12,211
Last 90 days
Query Speed
12.4×
Avg. acceleration across engines
Cost Savings
$1,374,672
Saved in last 3 months
CPU & Storage
-76%
Last 90 days
Data Optimized
46.8 PB
Last 30 days

Key Metrics

Total Tables
786
Tables in all catalogs
Critical Tables
70
Require immediate attention
Warning Tables
105
Should be addressed or auto-piloted
Healthy Tables
566
Tables in optimal state
Total Data
112.4 PB
Total lake data size

Storage

-56% reclaimed
30d
112 TB75 TB38 TB
Storage used

CPU

-76% reduction
30d
100%66%33%
Compute hours

Recent Operations

Last 10 operations
OperationTableDurationImpactTimeStatus
Compact Data Files
customer_orders
orders
4s1.24 TB, 16 → 1 files57 minutes agoSUCCESS
Expire Snapshots
payment_transactions
payments
27s8.2 TB4 hours agoSUCCESS
Expire Snapshots
inventory_snapshots_20250702
warehouse
3s2.1 TB4 hours agoSUCCESS
Rewrite Manifests
raw_clickstream
analytics
1.9s3 → 1 manifests5 hours agoSUCCESS
Compact Data Files
product_catalog
products
6m 11.3s3,008 → 1,256 files6 hours agoSUCCESS

Lake Events

LiveLast 24 hours
Compact Data Files·customer_orders
ecommerce_prod·1.24 TB, 16 → 1 files
4s57 min agoOK
Expire Snapshots·payment_transactions
ecommerce_prod·12 snapshots expired
4.6s1h agoOK
Compact Data Files·raw_clickstream
marketing_events·970 → 87 files
9m 31.6s2h agoOK
Remove Orphan Files·user_sessions
marketing_events·847 MB reclaimed, 1,203 files
1m 12s3h agoOK
Rewrite Manifests·search_query_logs
ecommerce_prod·487 → 12 manifests
2.1s3h agoOK
Expire Snapshots·inventory_levels
warehouse_analytics·62 snapshots, 18.4 GB freed
27s4h agoOK
Compact Data Files·product_catalog
ecommerce_prod·3,008 → 1,256 files
6m 11.3s5h agoOK
Rewrite Manifests·shipping_events
warehouse_analytics·14 → 3 manifests
1.0s6h agoOK
Remove Orphan Files·balance_snapshots
warehouse_analytics·59,831 files, 74.8 GB
13m 6.9s7h agoOK
Compact Data Files·ad_impressions
marketing_events·42,633 → 69 files
2m 18s8h agoOK

Open and runs on your stack

AWS
Azure
Google Cloud
Snowflake
Databricks
Apache Flink
Apache Iceberg
Delta Lake
DuckDB
Dremio
Lakekeeper
ClickHouse
AWS
Azure
Google Cloud
Snowflake
Databricks
Apache Flink
Apache Iceberg
Delta Lake
DuckDB
Dremio
Lakekeeper
ClickHouse

The Problem

Where Iceberg costs silently grow

Without active maintenance, entropy compounds — files fragment, metadata bloats, and every query pays an invisible tax.

Slow queries from poor data layout

Fragmented files and suboptimal sort orders force queries to scan more data than necessary — increasing latency and compute cost on every read.

Storage bloat from dead data

Expired snapshots, orphan files, and unreferenced data accumulate continuously. Storage costs grow while none of that data serves a query.

Expensive compaction compute

JVM startup, garbage collection, over-provisioned clusters. The compute cost of maintaining tables often rivals the cost of querying them.

Manual maintenance overhead

Custom scripts, monitoring, and on-call support for compaction and cleanup. As the lake grows, toil scales linearly while team capacity stays flat.

How it works

Where the savings come from

Query CPU, storage waste, maintenance compute, engine selection, and ops overhead — five cost lines, each with its own fix.

Query-aware compaction12× faster

CPU billed per query

76% less

After compaction + sort by real access patterns

Files opened−62%
Before
After
Data scanned−51%
Before
After
Query CPU−76%
Before
After

Query speed

12×

faster after layout

Data scanned

51%

less per query

01 · Query-aware compaction

Compact files the way your queries actually read them

The largest line on the bill is query CPU. LakeOps watches production filters, joins, and group-bys, then physically re-sorts and merges files to match. Every query scans less, finishes faster, and costs less — on every engine.

  • 62% fewer files after compaction — less listing and open cost on object storage
  • 51% less data scanned: sorted layout lets engines skip irrelevant row groups
  • 12× faster queries compound into 76% less compute across the lake
Storage cleanupSequenced

Storage reclaimed

56% freed

Snapshots, orphans, and stale files — no rewrite required

Object storage44% live · 56% reclaimed
1

Expire snapshots

Drop stale table history

Expired
2

Remove orphans

Delete unreferenced files

Purged
3

Keep live data

Only what queries still read

Retained

02 · Storage cleanup

Stop paying for data no query will ever read

Expired snapshots, orphan files, and unreferenced data accumulate every day. LakeOps expires and purges them first — reclaiming storage at near-zero compute — then compacting only what is still live.

  • 56% storage reclaimed from snapshots, orphans, and stale files
  • Cleanup is a delete, not a rewrite — almost no extra CPU
  • Compaction never rewrites dead data, so maintenance spend stays lean
Maintenance computevs Spark

Maintenance compute

90% cheaper

Rust engine — no JVM, no GC, no idle cluster

Relative duration

100%
S3 Tables
26%
Spark
4%
LakeOps

Speed vs Spark

95%

faster execution

Compute per TB

90%

less than Spark

03 · Cheaper maintenance

The work itself costs 90% less than Spark

Compaction and cleanup still consume compute. LakeOps runs them on a purpose-built Rust engine — no JVM, no GC, no idle cluster — so table maintenance is a rounding error, not a second cloud bill.

  • 95% faster than Spark on the same tables and target file size
  • 90% less compute per TB compacted — no over-provisioned executors
  • Triggered by table health, not cron — no clusters waiting to run

Engine comparison

Compare engines side-by-side on cost, latency, throughput, and data scanned.

Select engines

Spark
Active
Trino
Active
Athena
Active
Snowflake
Active
DuckDB
Active
Flink
Active

Performance comparison

MetricSparkTrinoAthenaSnowflake
Query success rate99.2%99.5%99.9%99.8%
Average runtime3.1s1.8s2.3s2.1s
Cost per query$0.04$0.03$0.05$0.08
Total queries3,1202,4561,2801,876
Data scanned4.2 TB2.8 TB1.5 TB3.5 TB

Cost vs latency

Lower-left is ideal

Low cost
High cost

Success rate

Spark
99.2%
Trino
99.5%
Athena
99.9%
Snowflake
99.8%

04 · Query engine routing

Send each query to the cheapest engine that fits

The same SQL can cost several times more on the wrong engine. LakeOps routes by cost model and latency target — one endpoint, automatic dialect translation, per-team strategy.

  • 56% workload cost reduction from right-engine selection
  • Cost, performance, or balanced strategy per team or AI agent
  • Per-user and per-agent attribution so you see who spent what
Adaptive Maintenance
Running
Compaction Scope— what will be targeted this run

Monitoring started at seq #4,812. Everything written from that point on is in scope.

already compacted
38% hot zone — will compact
#4,812 baseline#7,104 watermark#8,506 now
📦Compaction
Last: 57 minutes agoNext: in 2h
62%
42% of data files are below the 384 MB size threshold
1.24 TB compactable — will merge into ~3 files at 512 MB target
16 delete files amplify read cost — compaction will absorb them
Snapshot Expiration
Last: 4 hours agoNext: in 20h
31%
12 of 83 snapshots have passed the retention window
Retention policy: 5.0 days
Table creates 3.2 snapshots/hr — stale ones accumulate quickly
📝Rewrite Manifests
Last: 5 hours agoNext: in 1h
78%
92 total manifests: 89 data + 3 delete
Accumulating 2.1 manifests/hr — metadata overhead grows
High manifest count degrades query planning and scan performance
🧹Orphan File Cleanup
Last: 7 hours agoNext: in 17h
15%
No orphan files detected in current scan window

05 · Zero ops overhead

Stop paying engineers to babysit tables

Cron jobs, Airflow DAGs, cleanup scripts, monitoring dashboards, on-call rotations — every table adds operational cost that scales linearly with your lake. LakeOps replaces all of it with a single control plane that scales from 50 to 5,000+ tables with zero additional ops work.

  • No Spark clusters to provision, tune, or keep warm for maintenance
  • Health-driven triggers skip healthy tables — no wasted compute on idle data
  • Platform teams reclaim weeks of engineering time per quarter

See It In Action

Watch how LakeOps cuts lakehouse costs

Compaction, cleanup, routing, and governance — see how each cost lever works in practice.

Watch demoYouTube ↗
LakeOps — lakehouse cost optimization walkthrough

Production benchmarks

5.5 TB compacted across production tables

Real compaction results on batch, streaming, delete-heavy, and multi-writer Iceberg tables — same Rust engine, same hardware.

101K → 19K
Files after compaction (81%)
2,522 MB/s
Peak compaction throughput
95%
Faster than Spark compaction
Faster queries after compaction
TableSizeWorkloadFiles (B → A)ThroughputTime
balance_snapshots1,192 GBTB-Scale batch11,9573,2701,572 MB/s11 min
events_analytics484 GBDelete-Heavy16,1287,198729 MB/s11m 21s
raw_sdk_events8 GBStreaming42,63369167 MB/s138s
site_traffic292 GBMulti-Writer2,7407541,465 MB/s3m 25s

Compaction speed

200 GB benchmark (seconds)

LakeOps221s
Spark1,612s

95% faster

Cost per TB

Normalized to Spark = 100%

LakeOps$5/TB
Spark$50/TB

90% cheaper

Query time

Avg. query latency after compaction

After1.5s
Before12.1s

8x faster queries

Connect in minutes
- no vendor lock-in

1

Connect catalogs & engines

Only metadata is processed — never retained or stored.

Apache Iceberg
AWS
Snowflake
DuckDB
2

Get visibility & insights

Telemetry reveals table health and actions needed.

Table health scores
Optimization opportunities
Cost & performance insights
3

Choose your mode

Autopilot, manual approval, or policy-driven.

Autopilot
Manual
Policies
4

Lakehouse optimized

Queries 10x faster
Cost down 76%
Engines optimized
AIs managed
Tables healthy
Fully governed
Set up in 10 minutes · Works with your existing stack

See your projected savings
in 10 minutes.

Connect your catalog and get a free cost analysis — see exactly where your lake is overspending.