





Observability & Governance
Know everything.
Govern your Lakehouse.
LakeOps unifies Iceberg observability and governance in one control plane — table health, proactive insights, cross-engine telemetry, policy enforcement, retention management, and full audit trails.
One control plane — any engine, catalog, or cloud
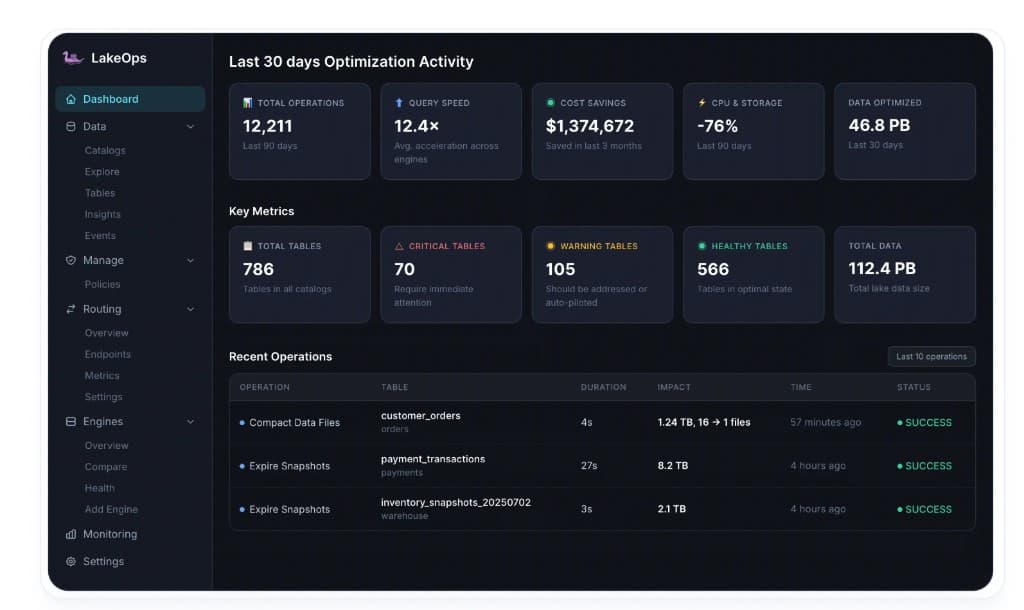
Last 30 days Optimization Activity
Key Metrics
Storage Trends
↑ 2.4 TB (3.1%)Recent Operations
| Operation | Table | Duration | Impact | Time | Status |
|---|---|---|---|---|---|
| Compact Data Files | customer_orders orders | 4s | 1.24 TB, 16 → 1 files | 57 minutes ago | SUCCESS |
| Expire Snapshots | payment_transactions payments | 27s | 8.2 TB | 4 hours ago | SUCCESS |
| Expire Snapshots | inventory_snapshots_20250702 warehouse | 3s | 2.1 TB | 4 hours ago | SUCCESS |
| Rewrite Manifests | raw_clickstream analytics | 1.9s | 3 → 1 manifests | 5 hours ago | SUCCESS |
| Compact Data Files | product_catalog products | 6m 11.3s | 3,008 → 1,256 files | 6 hours ago | SUCCESS |
Lake Events
Telemetry from across your stack
In the product
Full lake visibilitywith one-click actions
From executive health summary to per-table metrics and engine telemetry — each layer answers a different question platform teams ask every day.
Lake-wide dashboard
One screen for the health of your entire lake
After catalogs connect, LakeOps discovers every table and reads Iceberg metadata continuously. The dashboard summarizes health tiers, active insights, and lake scope — so platform teams start triage without writing SQL.
- Critical, Warning, and Healthy counts across all connected catalogs
- Table inventory with records, size, status, and last-modified at a glance
- Refreshes as schemas and namespaces evolve — no custom instrumentation

Table health classification
Structural scoring for every registered table
Health is computed from Iceberg signals teams already care about: file count and size distribution, manifest depth, snapshot accumulation, delete-file ratio, partition skew, and sort-order alignment with real query patterns.
- Critical — severe fragmentation or metadata bloat; planning or scans at risk
- Warning — degradation underway; likely to reach Critical without action
- Healthy — structural indicators within bounds you define per environment

Events & audit trail
Complete history of what changed and why
Every maintenance operation — compaction, expiration, orphan removal, manifest rewrite — is logged lake-wide and per table with duration, impact, and status. Observability closes the loop: see the problem, act, verify the outcome.
- Filter by catalog, operation type, and success or failure
- Before/after file and manifest counts on every event
- Compliance-ready trail for platform and data-governance teams

Actionable insights
Actionable alerts before users file tickets
Insights evaluate tables on a schedule and raise prioritized findings — each tied to a table, severity, and recommended next step. Remediate manually or let policies act on the same signal.
- CRITICAL — partition file explosions and runaway write patterns
- HIGH — manifest counts above threshold, snapshot backlog
- WARNING — partition skew, emerging small-file clusters
- LOW — early drift you can fix before the next compaction window

Table-level insights
Drill into the signals driving each table's health
Beyond lake-wide alerts, every table surfaces its own insights — manifest count vs. threshold, partition skew, small-file accumulation, and more. Each finding links directly to the affected table with severity and recommended action.
- Per-table severity breakdown — from CRITICAL to LOW
- Manifest fragmentation alerts with undersized-file counts
- Partition skew and small-file warnings before they compound

Explore & metrics
Per-table investigation without leaving the control plane
The Explore view and Metrics tab expose the full structural picture: records over time, active files, stale files, delete files, file-size histograms, and snapshot-level growth — the same data you would pull from Iceberg metadata tables, pre-joined and charted.
- Records distribution across recent snapshots — spot write-pattern changes
- File size histogram — % of files in optimal range vs. undersized
- Position and equality delete tracking for merge-on-read tables

Partition drill-down
See skew and hotspots before they become outages
The Partitions view breaks down file counts, byte distribution, and delete-file concentration per partition key. Spot the partitions driving planning timeouts or runaway compaction jobs — and act before they escalate.
- Per-partition file count and byte distribution at a glance
- Delete-file hotspots highlighted across partition keys
- Identify streaming-write explosions in individual partitions

Cross-engine telemetry
See how every engine uses your tables
LakeOps ingests query telemetry from the engines in your stack. Field-access analysis shows which columns appear in filters and joins; engine-level views show latency and load — so observability informs both triage and downstream optimization.
- SELECT, FILTER, and JOIN frequency per column
- Per-engine query volume and latency trends
- Hot tables and cold tables — prioritize maintenance where it matters

Governance
Policy-driven governance
built into the control plane.
Declarative policies + automated retention + full audit trail + cross-catalog enforcement + cost controls = governance on autopilot.
Declarative policies
Define once, enforce everywhere
Define compaction targets, snapshot retention, orphan cleanup thresholds, and manifest optimization rules at organization, catalog, namespace, or individual table scope. Policies cascade with inheritance — set defaults at the top, override where needed.
- Catalog-wide or per-table policy scoping with priority levels
- Cron-based scheduling with event-driven override triggers
- Full version history — rollback any policy change in one click
Compaction
Organization
Snapshot Retention
Catalog: analytics
Orphan Cleanup
Organization
Manifest Rewrite
Namespace: events
GDPR Deletion
Catalog: customers
Retention & compliance
Automated data lifecycle management
Set snapshot retention periods, GDPR deletion schedules, and storage tier policies. LakeOps enforces retention rules continuously across every table — no manual scripts, no forgotten cleanup jobs.
- Time-based and count-based retention with safety windows
- GDPR-compliant deletion with full audit trail
- Coordinated with compaction — expired data physically removed
Snapshot retention
Count max: 50
GDPR deletion
Full audit trail
Orphan cleanup
Safety window active
Cross-catalog enforcement
One policy layer across all catalogs and engines
Whether you run AWS Glue, Polaris, Nessie, Gravitino, or Lakekeeper — governance policies apply uniformly. No per-catalog scripts, no engine-specific maintenance logic.
- Uniform policy enforcement across AWS Glue, Polaris, Nessie, Gravitino
- Engine-agnostic — works with Trino, Spark, Snowflake, Databricks
- Zero drift between catalog governance and actual table state
AWS Glue
1,240 tables
Polaris
860 tables
Nessie
430 tables
Gravitino
215 tables
One policy, all catalogs
Zero drift between governance and table state
Lakehouse Control Plane
Cost down. Performance up.
Agentic AI ready.
Observability and governance are two layers of the control plane — explore maintenance, compaction, routing, and AI readiness alongside full visibility and policy enforcement.
Managed Lakehouse
The complete control plane — compaction, maintenance, cost optimization, routing, observability, governance, and AI readiness.
Explore platformIceberg Maintenance
Snapshot expiration, manifest rewrites, orphan cleanup, and metadata — automated, sequenced, and safe.
Explore maintenance95% Faster Compaction
Rust engine, not Spark. Sorts data by real query patterns so reads skip entire file groups. $5/TB vs $50.
Explore compactionQuery Routing & Acceleration
Route queries across Trino, Spark, Snowflake, and more — optimized for cost, latency, or throughput per workload.
Explore routingObservability & Governance
Table health, insights, cross-engine telemetry, policies, retention, and audit trails — one control plane.
Explore observabilityAgentic AI Readiness
Agent-native MCP interface, guardrails, and a self-optimizing lake ready for AI agents and autonomous pipelines.
Explore AI enablementThe gap
Iceberg gives you metadata —
not monitoring or governance
Without continuous observability and policy enforcement, tables degrade silently and governance depends on tribal knowledge instead of automated control.
Iceberg has metadata, not monitoring
Metadata tables expose snapshots, files, and manifests — but no native health scores, alerting, or lake-wide dashboards. Platform teams run one-off Spark SQL until something breaks.
Visibility is split across silos
Object-storage metrics, engine query UIs, and Iceberg catalog APIs each tell part of the story. Correlating a slow dashboard with manifest bloat takes days of manual investigation.
Degradation is silent until queries hurt
Small files, manifest sprawl, and snapshot buildup compound over weeks. Planning time grows, scans widen, and nobody notices until analysts or agents report failures.
Multi-engine lakes multiply blind spots
Trino, Spark, Snowflake, Athena, DuckDB, and Flink each see the same tables differently. Without unified telemetry, you cannot tell which engine or table is actually driving cost and latency.
Connect your catalogs.
See and govern everything in minutes.
LakeOps reads Iceberg metadata from every connected catalog, classifies table health, and surfaces insights — no agents, no pipeline changes, no manual SQL to get started.