

The modern data lakehouse with Apache Iceberg gives you open formats, multi-engine access, and decoupled storage and compute. Iceberg on S3, readable by Spark, Trino, Flink, Snowflake, DuckDB, Athena — no proprietary lock-in, no single-vendor dependency. The architecture is right.
What it does not give you is a way to keep it all running well.
Every Iceberg table accumulates structural debt from its first commit. Files fragment. Snapshots pile up. Manifests grow. Orphan files appear on storage. Query performance degrades silently. Storage costs climb linearly. No single engine owns the problem because the architecture is deliberately decoupled — and Iceberg itself ships raw maintenance procedures, not operational intelligence.
A control plane — the concept explored in depth in Iceberg control plane introduced — is the architectural layer that fills this gap. An intelligent control plane goes further — it continuously observes, adapts, and optimizes every table based on real signals rather than fixed rules. This is the difference between automating what you already know (scripts) and building a system that figures out what's needed (intelligence).
The operational gap in open lakehouses
In a data warehouse (Snowflake, BigQuery, Redshift), the vendor manages everything: storage layout, compaction, statistics, garbage collection. You write SQL; the system handles the rest. The trade-off is lock-in — your data lives in a proprietary format, accessible only through that vendor's engine, at that vendor's pricing.
The lakehouse layer between lakes and warehouses inverts this. You own the data in open formats. Any engine can read it. But that openness creates an operational vacuum: who maintains the tables?
Iceberg ships four maintenance procedures — snapshot expiration, orphan file removal, data file compaction, and manifest rewriting. These are raw primitives. They require external intelligence to determine when to run, on which tables, with what parameters, in what order, how to handle conflicts with concurrent writers, and how to adapt when workloads change. Without something providing this intelligence, each table becomes an independent operational problem that scales linearly with table count.
At 20 tables, you write scripts. At 200, you maintain the scripts full-time. At 2,000, the scripts themselves need a team.
What is a control plane
The term comes from networking and distributed systems. In a network, the control plane decides where traffic goes; the data plane moves packets. In Kubernetes, the control plane (API server, scheduler, controllers) observes cluster state and reconciles toward desired state. The data plane (kubelets, container runtime) does the work.
Applied to a data lakehouse:
- Control plane — observes table health across the lake, decides what maintenance and optimization each table needs, executes it in the correct sequence, verifies outcomes
- Data plane — the underlying infrastructure: object storage holding data files, catalogs managing metadata, engines executing queries
The control plane does not replace your catalog, engines, or storage. It adds the missing operational intelligence layer — the same way Kubernetes makes a container cluster self-healing without replacing Docker or the VMs underneath.
What makes a control plane intelligent
A scheduler runs jobs at fixed times. An intelligent control plane is a closed-loop system — it continuously observes, decides, acts, and learns. The distinction matters because lakehouses are dynamic: write patterns change hourly, query patterns shift with business cycles, new tables appear daily, and degradation rates vary by orders of magnitude between tables.
The loop:
Sense — collect structural signals from every table (file count, snapshot depth, manifest count, delete-file ratio, sort alignment, orphan volume) and query telemetry from every connected engine (which columns are filtered, joined, grouped — how frequently, from which engine).
Classify — score each table's health as Healthy, Warning, or Critical based on combined signals. A table with 50,000 small files is critical for compaction. A table with 12,000 snapshots is critical for expiration. Classification is relative to each table's configured policy — not a universal threshold.
Plan — for each table needing attention, determine exact operations, parameters, and sequence. Identify partitions with active writers and exclude them. Select optimal sort order from cross-engine telemetry. Validate strategies through layout simulations before committing.
Execute — run the sequenced pipeline (expire → orphans → compact → manifests) with conflict-aware commits, automatic OCC retry, and incremental progress. Operations complete on a purpose-built engine — no Spark cluster overhead.
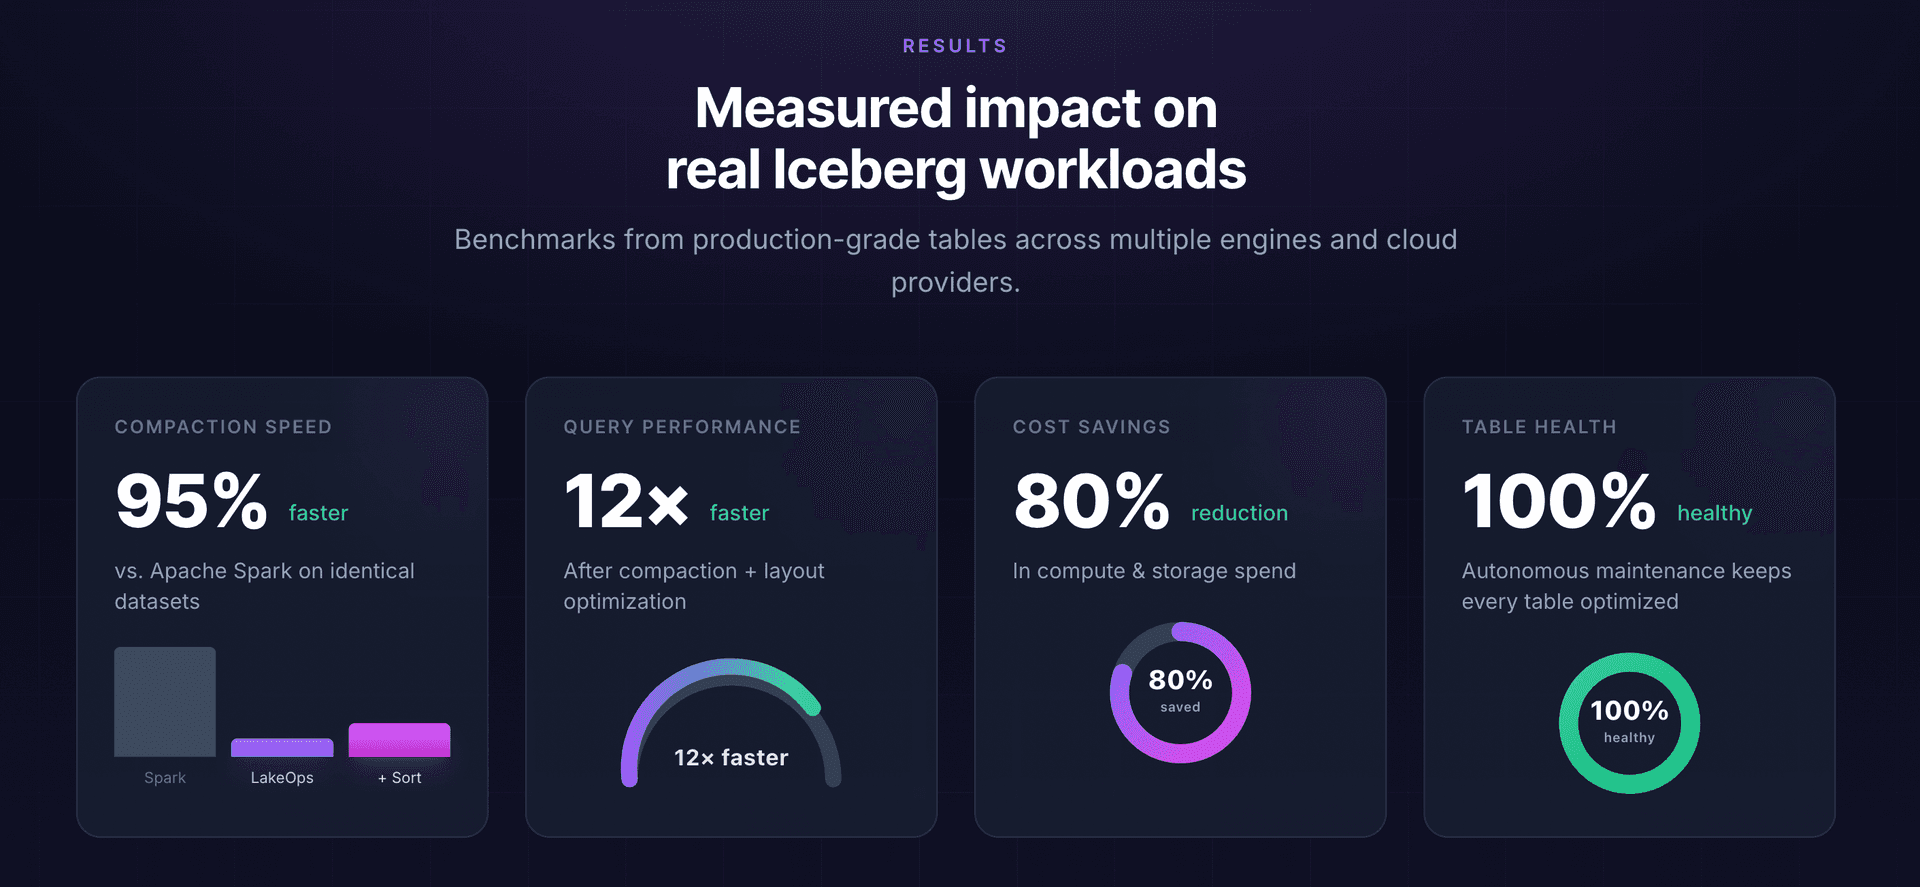
Learn — measure outcomes (files before/after, planning latency delta, query speed change, bytes reclaimed). Feed results back into future classification and planning. Tables where sort compaction produced 12× improvement get prioritized for sort maintenance. Tables where bin-pack sufficed skip unnecessary rewrites.
This loop runs continuously. Healthy tables cost zero compute. Degraded tables get immediate attention. The system improves with every cycle.

What an intelligent lakehouse control plane does
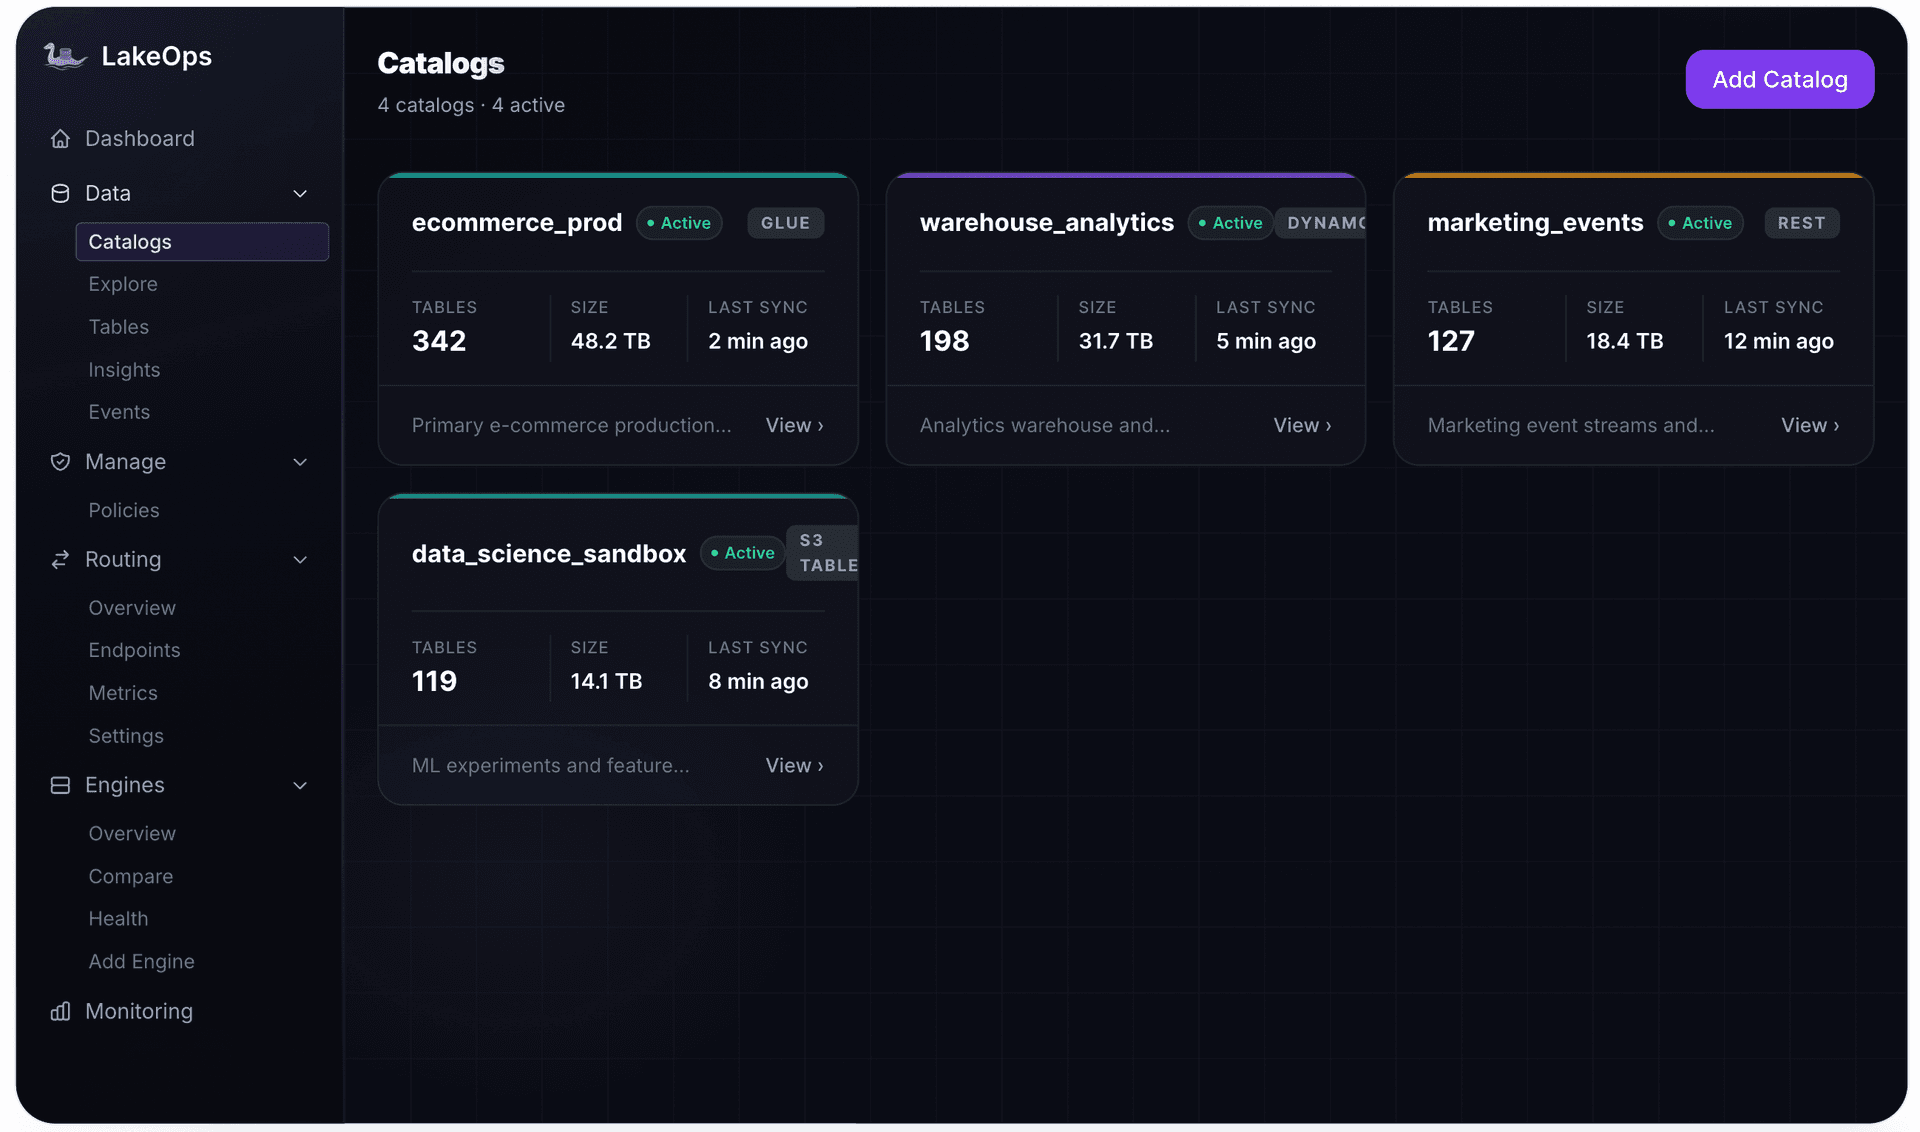
LakeOps is a purpose-built implementation of this for Apache Iceberg. It connects to your existing catalogs and engines through standard APIs, adds autonomous operational intelligence across the lake, and operates without moving data, changing code, or introducing vendor lock-in. Everything flows through standard Iceberg REST catalog APIs — metadata reads and atomic commits through your catalog.
Autonomous table maintenance
The full maintenance lifecycle — snapshot expiration, orphan cleanup, compaction, manifest rewriting, position delete optimization, and Puffin statistics computation — runs as a coordinated, sequenced pipeline per table. Operations fire based on health signals, not fixed schedules. Each cycle respects the dependency chain so no operation runs on stale preconditions.
Adaptive cadence means a streaming table committing every 30 seconds gets compacted multiple times per hour. A weekly batch table gets compacted once. A table nobody is writing to gets nothing. Each table receives exactly what it needs — the same adaptive approach that enables AI agents to manage Iceberg maintenance and compaction autonomously — with no wasted compute on healthy tables, no gaps on degraded ones.


Query-driven compaction
This is where intelligence matters most. Standard compaction merges small files into bigger ones (bin-pack). That helps. But query-driven compaction goes further: it learns which columns queries actually filter, join, and group by — across all engines — and physically re-sorts data to match during compaction.
When data is sorted by the columns queries use in WHERE clauses, Parquet row-group min/max statistics become tight. Engines skip irrelevant files without reading them. The result is 51% less data scanned, queries dropping from 52 seconds to 5.8 seconds on the same data — automatically, without anyone manually configuring sort keys.
Before committing a sort strategy to production, layout simulations replay actual query patterns against the proposed layout on an Iceberg branch and measure projected scan reduction. Bad sort decisions are caught before they touch production data.

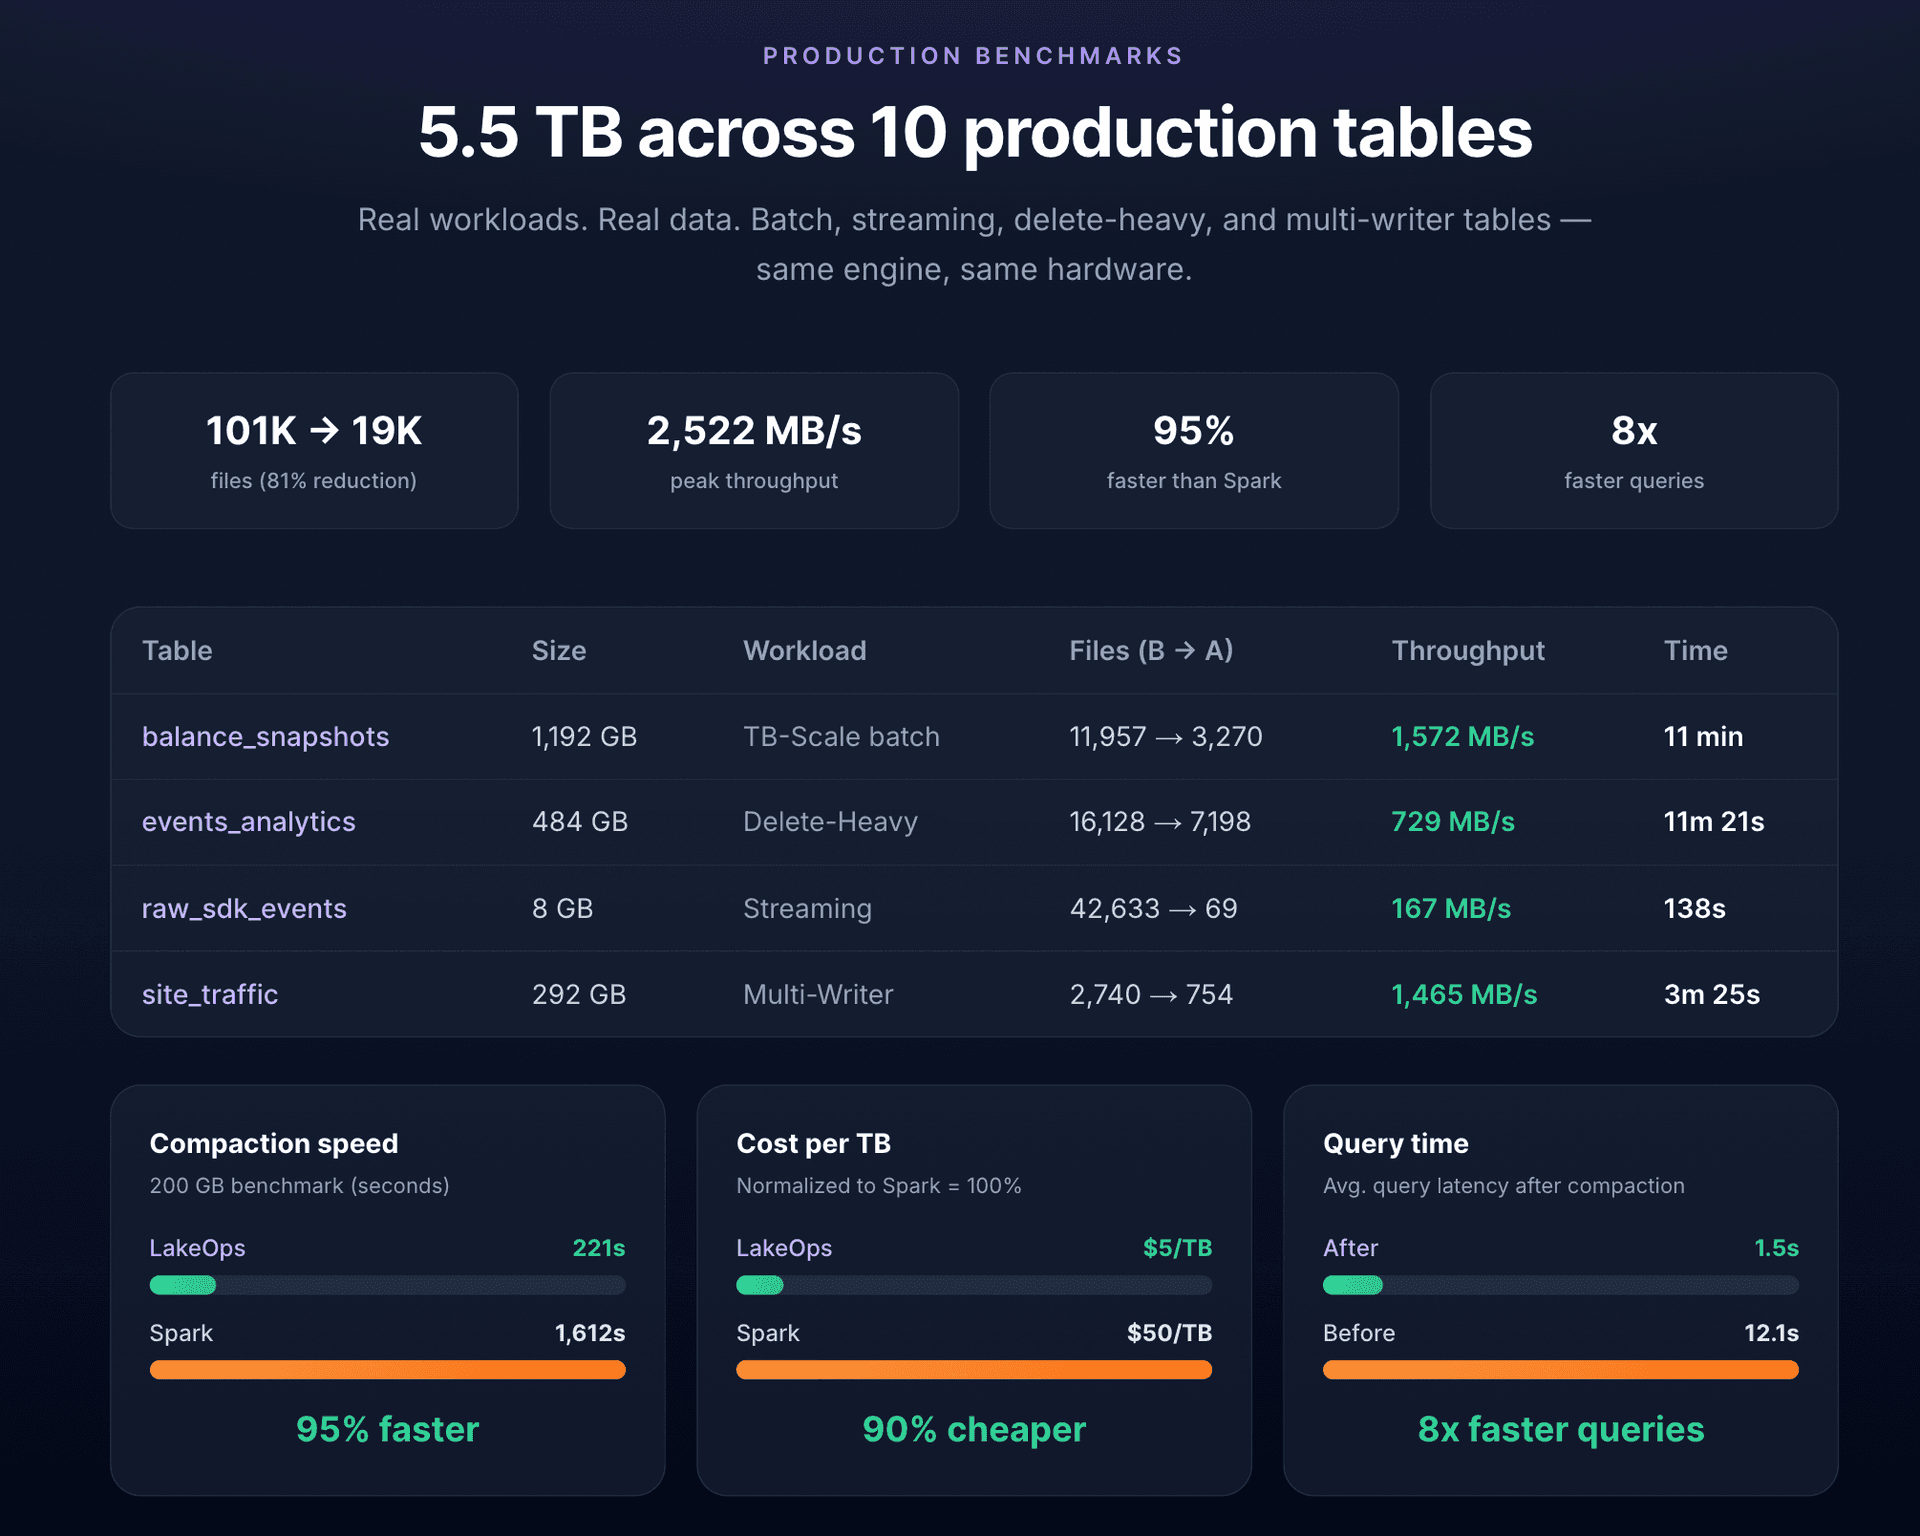
The execution engine is purpose-built Rust powered by Apache DataFusion. No JVM, no GC pauses, no OOM. 221 seconds vs 1,612 seconds for Spark on the same 200 GB dataset. 95% faster, 90% cheaper per TB — fast enough to run continuously so tables never degrade between maintenance windows.
Multi-engine query routing
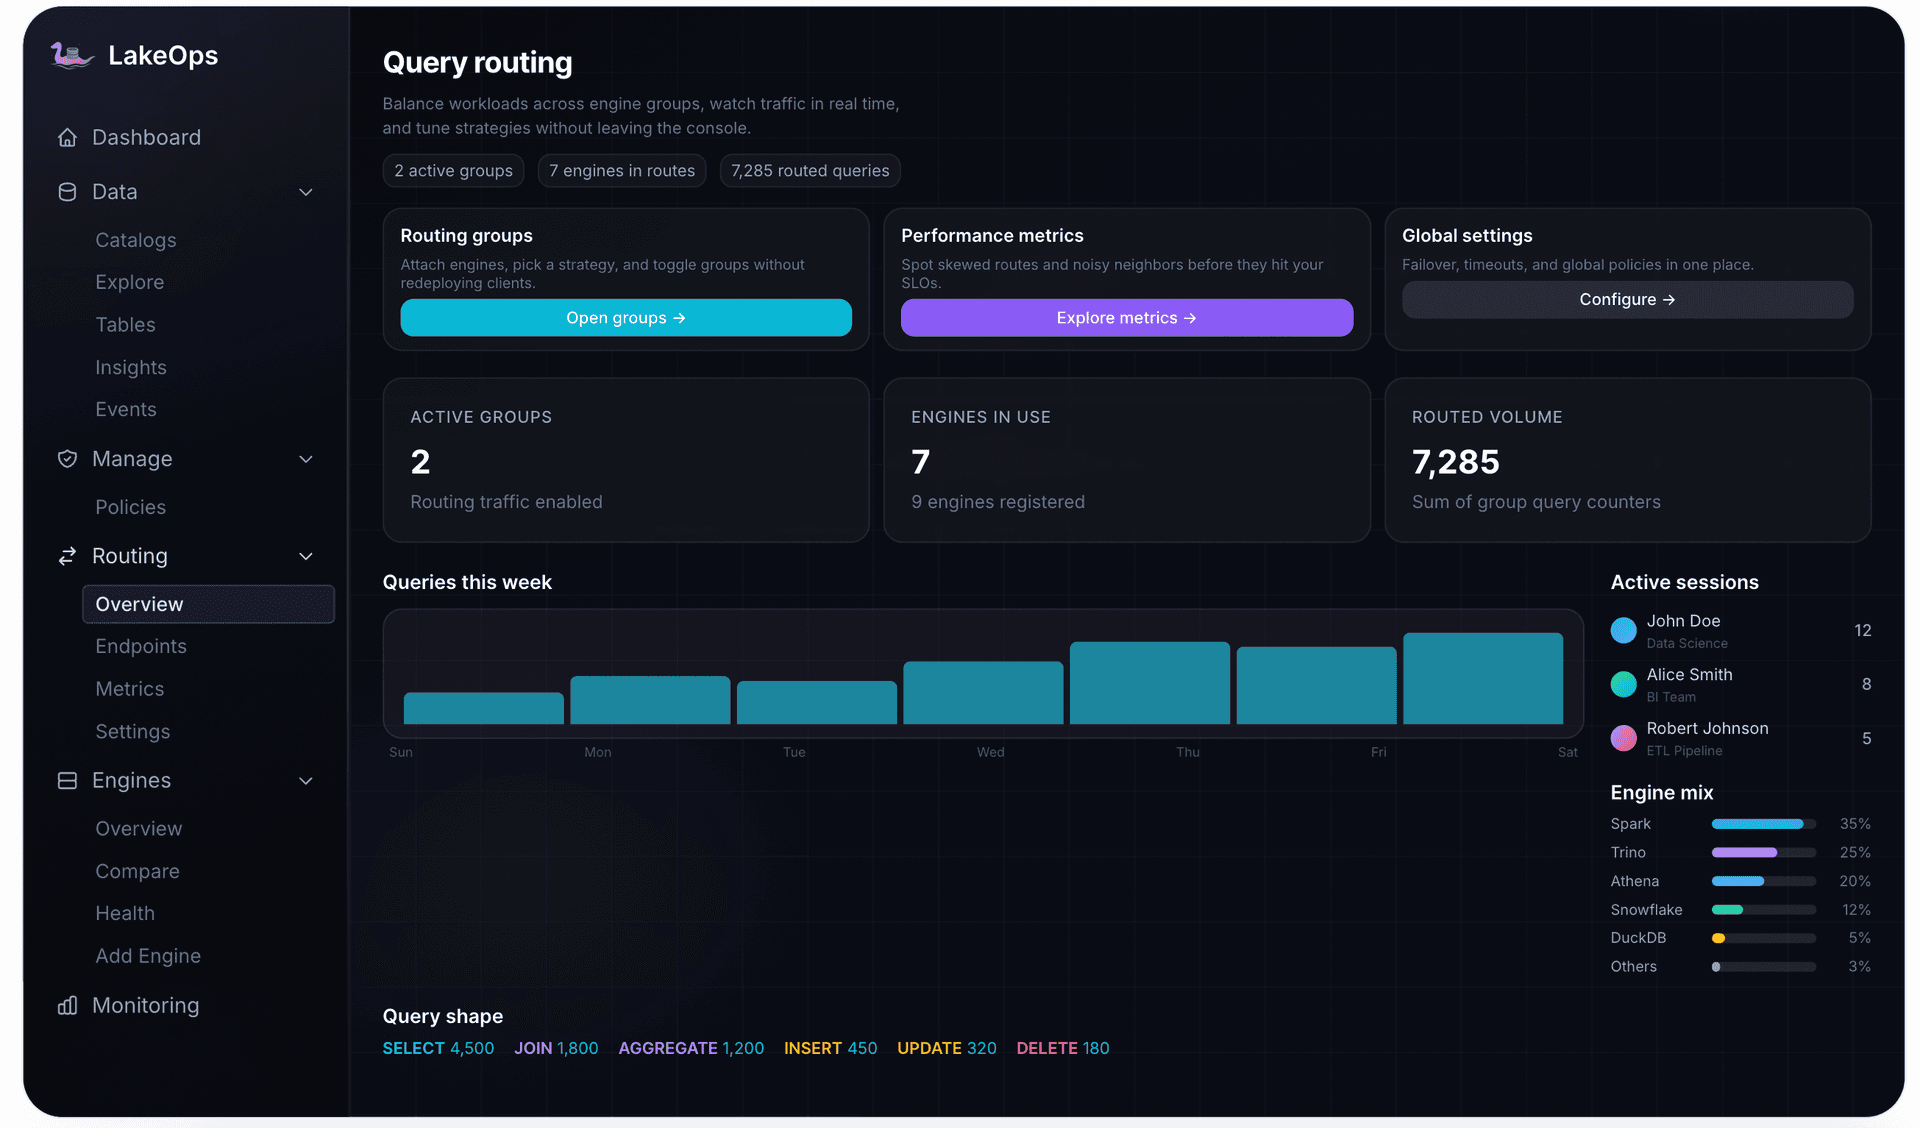
Production lakehouses run multiple engines against the same tables. Without routing, applications hardcode engine connections — every query goes to one engine regardless of cost or latency characteristics.
LakeOps query routing dispatches each query to the optimal engine based on query shape, latency targets, cost ceilings, and engine availability. Point lookups route to DuckDB (0.5s). Heavy aggregations route to Spark. Dashboard queries route to Trino. Each workload — including AI agents connected to Iceberg via MCP — gets its own routing group with capacity limits, fallback rules, and SLA targets.
The routing layer and maintenance layer form a reinforcing loop: compaction and sorting unlock cheaper engines for more query shapes (a well-sorted table can serve lookups from DuckDB that a fragmented table cannot). Routing telemetry feeds back into compaction decisions (knowing which queries hit which tables informs sort-order selection). Both improve simultaneously.
Observability and insights
You cannot maintain what you cannot see. Iceberg has no built-in health dashboards, no cross-engine telemetry, no alerting. Teams running manual maintenance discover degradation when users complain.
The observability layer provides unified table health classification — every table continuously scored as Healthy, Warning, or Critical based on structural signals. Cross-engine query telemetry shows which columns are filtered, joined, and grouped from every connected engine, aggregated into a single access profile per table. Proactive insights surface problems before users notice: partition explosions, manifest bloat, emerging small-file clusters — each with severity and recommended action.


Policy-based governance
Declarative policies define maintenance rules at organization, catalog, namespace, or individual table level. Everything cascades with inheritance — set defaults at the top, override where needed. Policies cover compaction targets, snapshot retention, orphan cleanup thresholds, manifest optimization, sort strategies, and alerting rules.
New tables automatically inherit the correct configuration from their namespace. No onboarding ticket, no forgotten config. All policies are versioned, auditable, and reversible — roll back any change with full visibility into what changed and when.

Events and audit trail
Every maintenance operation is logged lake-wide and per table: what ran, when, duration, files before/after, bytes reclaimed, health score delta, and the signal that triggered it. The audit trail is continuous and structured — not scattered across Airflow logs and Spark driver output.
For compliance environments requiring proof of data lifecycle management (GDPR deletion, retention enforcement, SOC 2 audit), the trail satisfies what manual operations require custom logging to achieve.

Cost optimization
Storage waste from orphan files, snapshot-pinned data, and over-provisioned layouts accumulates silently. Compute waste from scanning fragmented tables, reading unnecessary files, and running compaction on Spark clusters compounds monthly.
The control plane continuously reclaims storage waste through automated lifecycle management (expiration, orphan cleanup, and efficient compaction). Compaction on a dedicated Rust engine eliminates Spark cluster costs. Query routing moves workloads to optimal pricing models. The combined effect is typically 80% reduction in lake operational costs — storage, compute, and maintenance overhead.
Agentic AI readiness
AI agents and LLM-based analytics need sub-second query responses, consistent data quality, and predictable costs. A degraded lake — fragmented files, stale statistics, unbounded scan times — breaks these requirements silently. The control plane ensures every table is continuously optimized for the access patterns AI agents use, keeping the Iceberg lakehouse AI-ready without dedicated engineering effort.
How it differs from scripts
Most teams start with Airflow DAGs or cron jobs calling Spark SQL procedures. This works for small, stable deployments. The architectural differences from an intelligent control plane:
Trigger model. Scripts run on fixed schedules (hourly, daily, weekly). A control plane triggers on health signals — a table gets maintenance when it needs it, not when the clock says so.
Intelligence. Scripts encode a fixed decision at authoring time. A control plane adapts — learns from telemetry, adjusts sort orders, changes cadence as write patterns evolve.
Sequencing. Scripts are correct within one DAG but uncoordinated across DAGs. A control plane enforces the full dependency chain (expire → orphans → compact → manifests) per table, every cycle.
Conflict handling. Scripts either fail on OCC conflicts or don't handle them. A control plane identifies active writer partitions, excludes them, and retries conflicts automatically.
Sort optimization. Scripts use a static sort column list chosen at authoring time. A control plane derives sort order from cross-engine query telemetry and validates it through simulations.
Scaling. Scripts require explicit configuration per table — linear effort with table count. Policies inherit hierarchically — sublinear effort.
Execution cost. Scripts run on Spark (JVM, GC, cluster overhead, ~$50/TB). A dedicated Rust engine runs at ~$5/TB.
Observability. Scripts produce Airflow task logs. A control plane produces structured health, telemetry, insights, and audit trails in one place.
The fundamental issue is not that scripts execute incorrectly — they do the right thing. The issue is they cannot adapt to runtime conditions. A table that was batch-only when you wrote the DAG may become streaming. A sort order from January may not match August queries. A cadence appropriate for 50 tables fails at 500.
Architecture: open lakehouse stays open
A critical requirement: the control plane must not undermine the openness that made the lakehouse worth building. This is what separates a true managed lakehouse control plane from a managed service that absorbs your data into a proprietary system.
LakeOps operates with three guarantees:
No data movement. Data never leaves your storage. All operations happen through standard Iceberg commit APIs — metadata reads and atomic commits through your catalog. LakeOps processes only metadata; data files stay where they are.
No code or infrastructure changes. Connect catalogs and engines through standard APIs. No SDK integration, no pipeline modifications, no new infrastructure to deploy. Works alongside your existing stack without touching it.
No vendor lock-in. Everything produced is standard Iceberg — snapshots, manifests, data files, statistics. Disconnect the control plane and your tables remain exactly as they are. No proprietary formats, no migration required, no exit cost.
Getting started
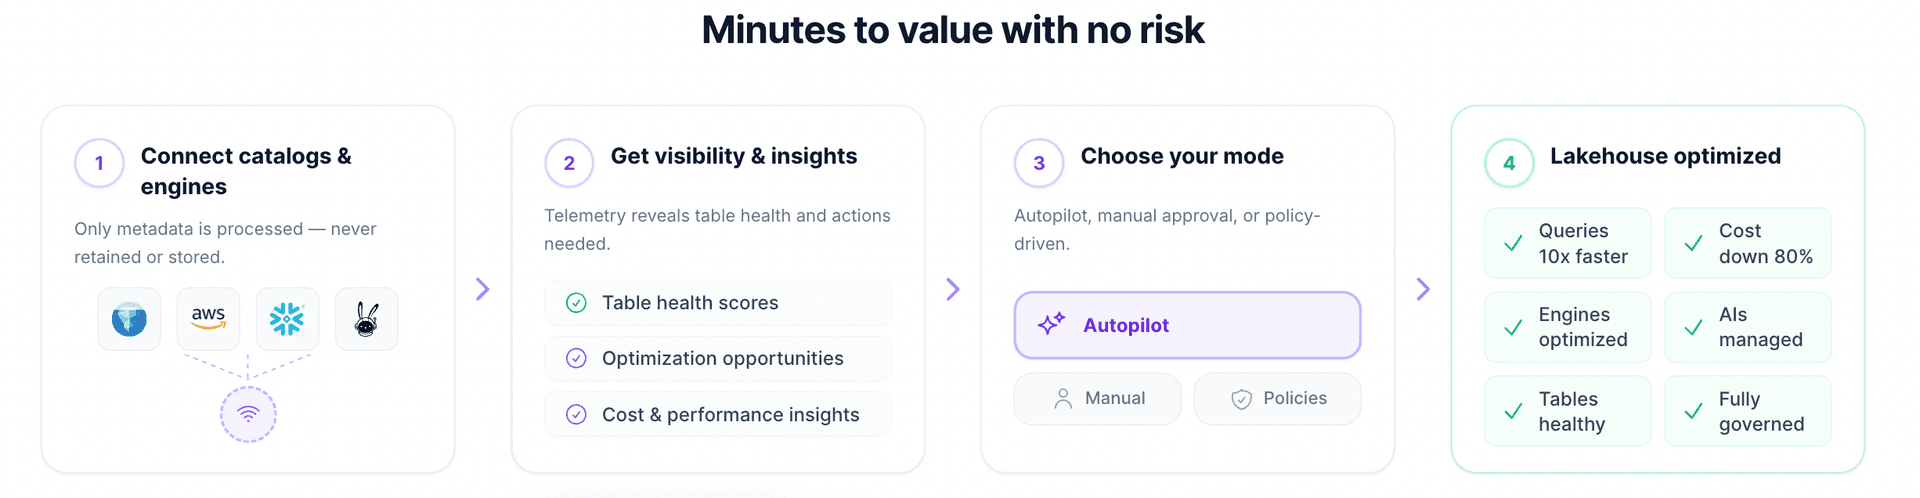
Connect your catalogs to LakeOps — AWS Glue, Polaris, Nessie, Gravitino, Lakekeeper, S3 Tables. Health classification begins immediately. Start in manual-approval mode where operations are recommended but require sign-off. Define policies at the namespace level. Enable autonomous mode once confidence is established. Connect engines for cross-engine telemetry — sort optimization and routing unlock.
The lake becomes self-maintaining. New tables inherit policies. Degraded tables get immediate attention. Healthy tables cost nothing. Engineering shifts from running maintenance to reviewing outcomes — which is what platform teams should be doing.