
You adopted Iceberg. You set up a REST catalog. Spark and Trino both read the same tables. The architecture is clean, the format is open, and for the first few months everything works. Then the queries start slowing down. A dashboard that loaded in two seconds takes fourteen. An analyst files a ticket. You check the table and find 40,000 small files, 8,000 accumulated snapshots, and manifests so fragmented that the query planner spends more time reading metadata than data. Nobody changed anything. The table just degraded under normal write load — because Iceberg tables always do, and nothing in your stack was watching.
This is the point where the term "Iceberg control plane" enters the conversation — and where it gets confusing. The catalog vendor calls their product a control plane. The maintenance automation tool calls itself a control plane. The managed service calls itself a control plane. The term has become so overloaded that it hides the two very different problems it refers to, and choosing the wrong layer (or missing one entirely) creates operational debt that compounds with every table you add.
This guide separates those two problems — building on the full control plane concept with an Iceberg-specific lens. The first is catalog-level control — metadata resolution, credential vending, access policies, commit coordination. The second is operational control — table health monitoring, autonomous maintenance, query-aware optimization, lake-wide governance. Both are necessary. Neither replaces the other. And the gap between the two is where most production Iceberg deployments struggle.
LakeOps is the autonomous operational control plane we built to close that second gap. It connects to your existing catalogs and query engines, monitors every table's health, runs the full maintenance lifecycle in correct dependency order, and optimizes file layouts based on actual query patterns — all through standard catalog metadata APIs, with no data movement, no code changes, and no pipeline modifications. Setup takes ten minutes. This article explains why both control-plane layers matter, what each one actually does, and how they fit together.
What "control plane" means in an Iceberg context
The concept comes from distributed systems. In networking, the control plane decides where traffic goes; the data plane moves packets. In Kubernetes, the control plane (API server, scheduler, controllers) manages cluster state while the data plane (kubelets, container runtimes) runs workloads.
In an Apache Iceberg deployment, the same split exists — but the responsibilities are divided across two layers that are often conflated:
- Catalog control plane — resolves metadata pointers, manages credentials, enforces access policies, coordinates commits
- Operational control plane — monitors table health, executes maintenance, optimizes file layouts, governs policies lake-wide, routes queries
The catalog tells your engines where the table is and who can access it. The operational layer tells you whether the table is healthy and keeps it that way. Both are necessary. Neither replaces the other.
The catalog control plane: metadata, auth, and coordination
The Iceberg REST Catalog specification — published as an open standard — defines the API boundary between compute engines and table metadata. Any catalog that implements the spec becomes readable by any engine that speaks it. This collapses the old O(engines × catalogs) integration matrix into a single protocol. The REST spec started as a way to stop writing a catalog client for every engine. It ended up as the substrate for everything the modern lakehouse needs from its metadata layer.
A catalog control plane handles five responsibilities:
- Metadata resolution — maps table names to the current
metadata.jsonpointer in object storage. Without this pointer, no engine can read or write the table. - Credential vending — issues short-lived, table-scoped storage tokens so compute engines never hold long-lived cloud keys. A leaked credential is scoped to one table for a few minutes. Remote signing goes further — the engine never touches credentials at all; the catalog pre-signs each file access.
- Access control — enforces who can read, write, or administer each table and namespace. Implementations range from IAM integration (Glue) to built-in RBAC (Polaris) to OpenFGA-based policies (Lakekeeper).
- Commit coordination — sequences concurrent writers with server-side conflict resolution instead of client-side optimistic locking. Multi-table atomic commits (REST v2) extend this to cross-table transactions — something no client-side catalog ever could.
- Scan planning — the Iceberg 1.11 release added a REST scan-planning client, letting the catalog plan scans on the server and hand back a filtered plan. This is foundational for cross-engine governance: the catalog can apply row-level filters and column masks during planning, so the policy holds regardless of which engine or AI agent asks for the data.
The catalog landscape has matured rapidly:
- Apache Polaris — graduated to an ASF Top-Level Project in February 2026. Community-governed, vendor-neutral, with built-in RBAC, credential vending, and catalog federation.
- Snowflake Open Catalog — a fully managed deployment of Polaris with zero self-hosting overhead.
- Unity Catalog — open-sourced by Databricks under the Linux Foundation for multi-format governance across Iceberg, Delta, and Hudi.
- AWS Glue — added REST Catalog support, integrating the standard protocol alongside its native metastore.
- Gravitino — unifies metadata across Iceberg, Hive, and external systems under a single federated catalog layer.
- Nessie — the only catalog offering Git-style branching, tagging, and merge operations on table metadata.
- Lakekeeper — a Rust-native catalog with OpenFGA-based fine-grained access control.
Each emphasizes a different slice of the catalog surface. For a detailed comparison of all seven, see the practical guide to choosing an Iceberg catalog.
The catalog control plane is essential infrastructure. But here is what it does not do.
What the catalog does not cover
A catalog resolves the pointer to a table's current metadata. It does not inspect that metadata to determine whether the table is degraded.
No catalog — not Polaris, not Glue, not Unity, not Gravitino — does any of the following:
- Detect that a table has accumulated 40,000 small files and queries are scanning all of them
- Identify that 12,000 snapshots are pinning data that should have been garbage-collected months ago
- Notice that 200 manifest files are forcing the query planner to open each one before any data is read
- Discover that orphan files from aborted writes are consuming 30% of your storage bill
- Recognize that a table's sort order no longer matches the columns your queries actually filter on
- Alert you before a degraded table impacts downstream dashboards and reports
These are not edge cases. They are the default state of every Iceberg table under active write load. The format is deliberately decoupled — storage, catalog, and compute are independent layers. That independence is what makes Iceberg portable and multi-engine. But it also means that no single component in the stack owns table health.
Iceberg ships four maintenance procedures: snapshot expiration, orphan file removal, data file compaction, and manifest rewriting. These are raw SQL procedures and Java APIs. They do not self-schedule, self-sequence, self-monitor, or self-adapt. The operational intelligence — when to run, on which tables, in what order, with what parameters, and how to adapt as workloads change — is left entirely to the operator.
At 20 tables, you write scripts. At 200, you maintain the scripts full-time. At 2,000, the scripts themselves need a team. This is the operational gap that a second control plane fills.
How degradation compounds in practice
The gap is not theoretical. Here is what happens to a real table without an operational control plane.
Week 1: A new customer_events table starts receiving streaming writes from Flink — one commit every 30 seconds. Each commit produces two Parquet files, each under 5 MB. By the end of the week the table has 2,800 files across 168 manifests. Queries are fine because the data volume is still small.
Week 4: The table has 11,200 files. Manifest count has grown to 672. Query planning now takes longer than query execution on most reads — every manifest must be opened and evaluated before data is touched. Trino queries that returned in 800ms now take 4 seconds. Nobody notices because the dashboard auto-retries.
Week 8: 22,400 files. 1,344 manifests. Snapshots have not been expired, so metadata references files that were logically deleted weeks ago. Orphan files from three aborted Flink checkpoints are consuming 180 GB of S3 storage that no query will ever read. A sort order set during initial table creation no longer matches the columns that production queries actually filter on. The table is consuming more storage than a table ten times its logical size should need.
Week 12: An analyst reports that a daily summary report takes 52 seconds instead of the usual 6. An engineer opens Spark, looks at the table, sees the file count, and schedules a manual compaction. The compaction job runs for 45 minutes on a Spark cluster and OOMs halfway through because it tried to rewrite all partitions at once. The engineer restarts with a smaller batch size. Compaction completes but does not expire snapshots first — so it rewrites files that expiration would have removed. The storage bill does not go down. Manifests were not rewritten. The query planner is still slow.

This is not a failure of Iceberg. It is the expected behavior of a deliberately decoupled architecture operating without an operational layer. The format gives you transactions, time travel, and multi-engine access. It does not give you a system that keeps itself healthy. That is what the second control plane provides.
The operational control plane: health, maintenance, and intelligence
The distinction is architectural. The catalog handles metadata resolution and access control — the what and who. The operational control plane handles health, maintenance, and optimization — the how well and what to do about it. The two layers are complementary, not competing. You choose whichever catalog fits your security and governance requirements, and layer operational management on top.
An operational control plane sits between your catalogs, engines, and storage — not replacing any of them, but adding the intelligence that none of them provides. It reads Iceberg metadata through standard catalog APIs, collects query telemetry from every connected engine, and uses both to make maintenance decisions. Data never moves. Pipelines do not change. The control plane operates through the same atomic commit APIs your engines already use.

The core mechanism is a closed loop:
- Sense — read structural signals from every table's metadata: file count and size distribution, manifest depth, snapshot accumulation rate, delete-file burden, sort-order alignment, partition skew. Simultaneously collect query telemetry from every connected engine: which columns appear in WHERE, JOIN, and GROUP BY clauses, how frequently, and from which engine.
- Classify — score each table's health as Healthy, Warning, or Critical based on combined signals. Classification is relative to each table's policy — not a universal threshold. A streaming table with 5,000 files may be healthy if its target file size is 32 MB. A batch table with 5,000 files and a 512 MB target is critical.
- Plan — for tables needing attention, determine exact operations, parameters, and sequence. Identify partitions with active writers and exclude them. Select optimal sort order from cross-engine telemetry. Validate strategies through layout simulations on Iceberg branches before committing.
- Execute — run the sequenced maintenance pipeline (expire → orphans → compact → manifests) with conflict-aware commits and automatic OCC retry. Operations complete on a purpose-built engine — not a repurposed Spark cluster.
- Learn — measure outcomes: files before and after, planning latency delta, query speed change, bytes reclaimed. Feed results back into future classification and planning. Tables where sort compaction produced large improvements get prioritized for sort maintenance. Tables where bin-pack sufficed skip unnecessary rewrites.
Healthy tables cost zero compute. Degraded tables get immediate attention. The system improves with every cycle.
LakeOps is a purpose-built implementation of this for Apache Iceberg. It connects to your existing catalogs (Glue, Polaris, Nessie, Gravitino, Lakekeeper, S3 Tables) and query engines (Spark, Trino, Flink, Snowflake, Athena, DuckDB) without moving data or changing pipelines. Everything below describes how each component of the operational layer works — and what it changes in practice.
Lake-wide table health observability
The first requirement is visibility. You cannot maintain what you cannot see, and Iceberg has no built-in health dashboards, no cross-engine telemetry, and no alerting.
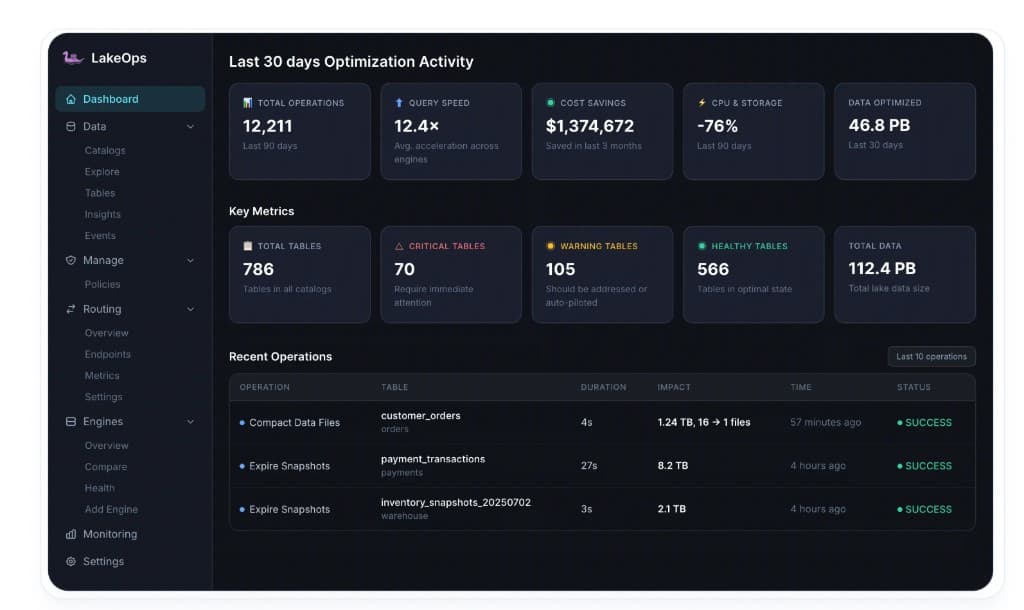
LakeOps continuously monitors structural signals from every table across every catalog — file count relative to target, small-file ratio, manifest depth, snapshot accumulation rate, delete-file burden, sort-order alignment with actual query patterns, and partition skew. Each table is classified as Healthy, Warning, or Critical based on these signals. The most degraded tables surface first.

This is not monitoring for monitoring's sake. Health classification is the input signal that drives every downstream decision — which tables get compacted, how urgently, in what order, and with what strategy. Without it, maintenance is either uniform (every table gets the same treatment regardless of need) or reactive (you discover degradation when users complain).
Proactive observability surfaces problems before they reach queries: partition explosions, manifest bloat, emerging small-file clusters, snapshot backlog — each with severity and recommended action.


Events, audit trail, and compliance
LakeOps logs every maintenance operation lake-wide and per table — what ran, when, duration, files before and after, bytes reclaimed, health score delta, and the signal that triggered it. The audit trail is continuous and structured — not scattered across Airflow logs and Spark driver output.
For compliance environments requiring proof of data lifecycle management — GDPR deletion enforcement, retention policy adherence, SOC 2 audit — the trail provides what manual operations require custom logging to achieve.

Autonomous maintenance in correct dependency order
Health signals are only useful if something acts on them. The core of an operational control plane is autonomous maintenance — the full lifecycle of operations that keep Iceberg tables healthy, executed in the correct sequence.
The sequence matters more than most teams realize. Snapshot expiration must run before compaction — otherwise you rewrite files that are about to be garbage-collected. Orphan cleanup must follow expiration — so that newly unreferenced files are swept up. Compaction operates on the clean, current dataset. Manifest rewriting runs last, consolidating metadata against the final file layout. Each operation's output is the next operation's clean input.
LakeOps enforces this dependency chain automatically. Cadence adapts to each table's write velocity — a streaming table committing every 30 seconds gets compacted multiple times per hour; a weekly batch table gets compacted once; a table nobody is writing to gets nothing. No wasted compute on healthy tables, no gaps on degraded ones.


For a deeper look at the full maintenance lifecycle and how autonomous orchestration replaces manual scripts, see the guide to autonomous Iceberg table maintenance.
Query-aware compaction
Standard compaction merges small files into bigger ones — bin-pack. That helps with file count, but leaves data physically unordered relative to how queries access it.
LakeOps takes this further with query-aware compaction. It observes which columns queries actually filter, join, and group by — across all connected engines — and physically re-sorts data to match during compaction. When data is sorted by the columns that appear in WHERE clauses, Parquet row-group min/max statistics become tight. Engines skip entire files without reading them.
Before committing a sort strategy to production, layout simulations replay actual query patterns against the proposed layout on an Iceberg branch. The proposed layout is applied, query patterns are replayed, and results are compared against the current baseline. Bad sort decisions are caught before they touch production data.

For a deeper breakdown of bin-pack versus sort strategies, see the guide to Iceberg compaction strategies.
The execution engine problem
Most teams run compaction on Spark because Iceberg ships Spark procedures and that is what the documentation shows. But compaction is a narrow, I/O-bound read-merge-write operation. Spark is a general-purpose distributed compute engine with JVM startup time, garbage collection pauses, executor provisioning overhead, and idle cluster costs. Using Spark for compaction is like provisioning a Hadoop cluster to copy files.
The mismatch shows up in three places. First, cost: a Spark cluster sized for compaction sits idle between jobs but still bills for reserved capacity. Second, reliability: large tables OOM when the JVM heap cannot hold file metadata during planning. Third, speed: JVM garbage collection introduces pauses that stretch a 200 GB compaction job from minutes to tens of minutes, during which the table continues accumulating new small files.
LakeOps replaces Spark with a purpose-built Rust engine powered by Apache DataFusion. Zero-copy Arrow columnar pipeline, bounded memory with disk spill, lock-free parallelism — no cluster to provision, no executor to tune, no OOM risk. On a 200 GB benchmark (600M rows, Parquet, partitioned by date), the Rust engine completes in 221 seconds at 2,522 MB/s peak throughput. Spark takes 1,612 seconds on the same hardware. That is 95% faster and 90% cheaper per TB — fast enough to run continuously so tables never degrade between maintenance windows.

The engine also learns from each run. Consecutive passes on the same table get faster without configuration changes — the planner adapts buffer sizes, parallelism, and partition strategy based on prior outcomes. A 1.2 TB table that OOMed Spark finishes in 11 minutes at $5/TB versus $50/TB.
Delete file resolution during compaction
Tables receiving updates and deletes — CDC pipelines, streaming upserts, GDPR deletions — accumulate position and equality delete files that every engine must reconcile at read time. This merge-on-read overhead compounds silently. A table with 800 position delete files adds hundreds of milliseconds to every query, and the overhead grows linearly with delete-file count.
LakeOps resolves deletes during the compaction pass — physically applying position and equality deletes into new base files, eliminating the delete files entirely. The table returns to zero merge-on-read overhead in one operation. Iceberg V3 deletion vectors (Roaring bitmaps) are supported natively. CDC and streaming tables stop paying the merge-on-read tax without a separate delete-resolution job.

Declarative policy governance
Optimizing tables individually does not scale. At hundreds of tables across multiple catalogs, with different teams expecting different retention windows and compaction cadences, maintenance rules need to be declared once and enforced everywhere.
LakeOps provides a hierarchical policy engine. Policies are scoped to organizations, catalogs, namespaces, or individual tables — with a specificity hierarchy where table-level overrides namespace-level, which overrides catalog-wide baselines. New tables automatically inherit the correct configuration from their namespace. No onboarding ticket, no forgotten config.
Policies cover compaction targets, snapshot retention windows, orphan cleanup thresholds, manifest optimization settings, sort strategies, and alerting rules. All policies are versioned, auditable, and reversible — roll back any change with full visibility into what changed and when.

This is the governance layer that catalog-level RBAC does not provide. Catalog access control answers who can query a table. Policy governance answers how that table should be maintained — and enforces it without human intervention.
Multi-engine query routing
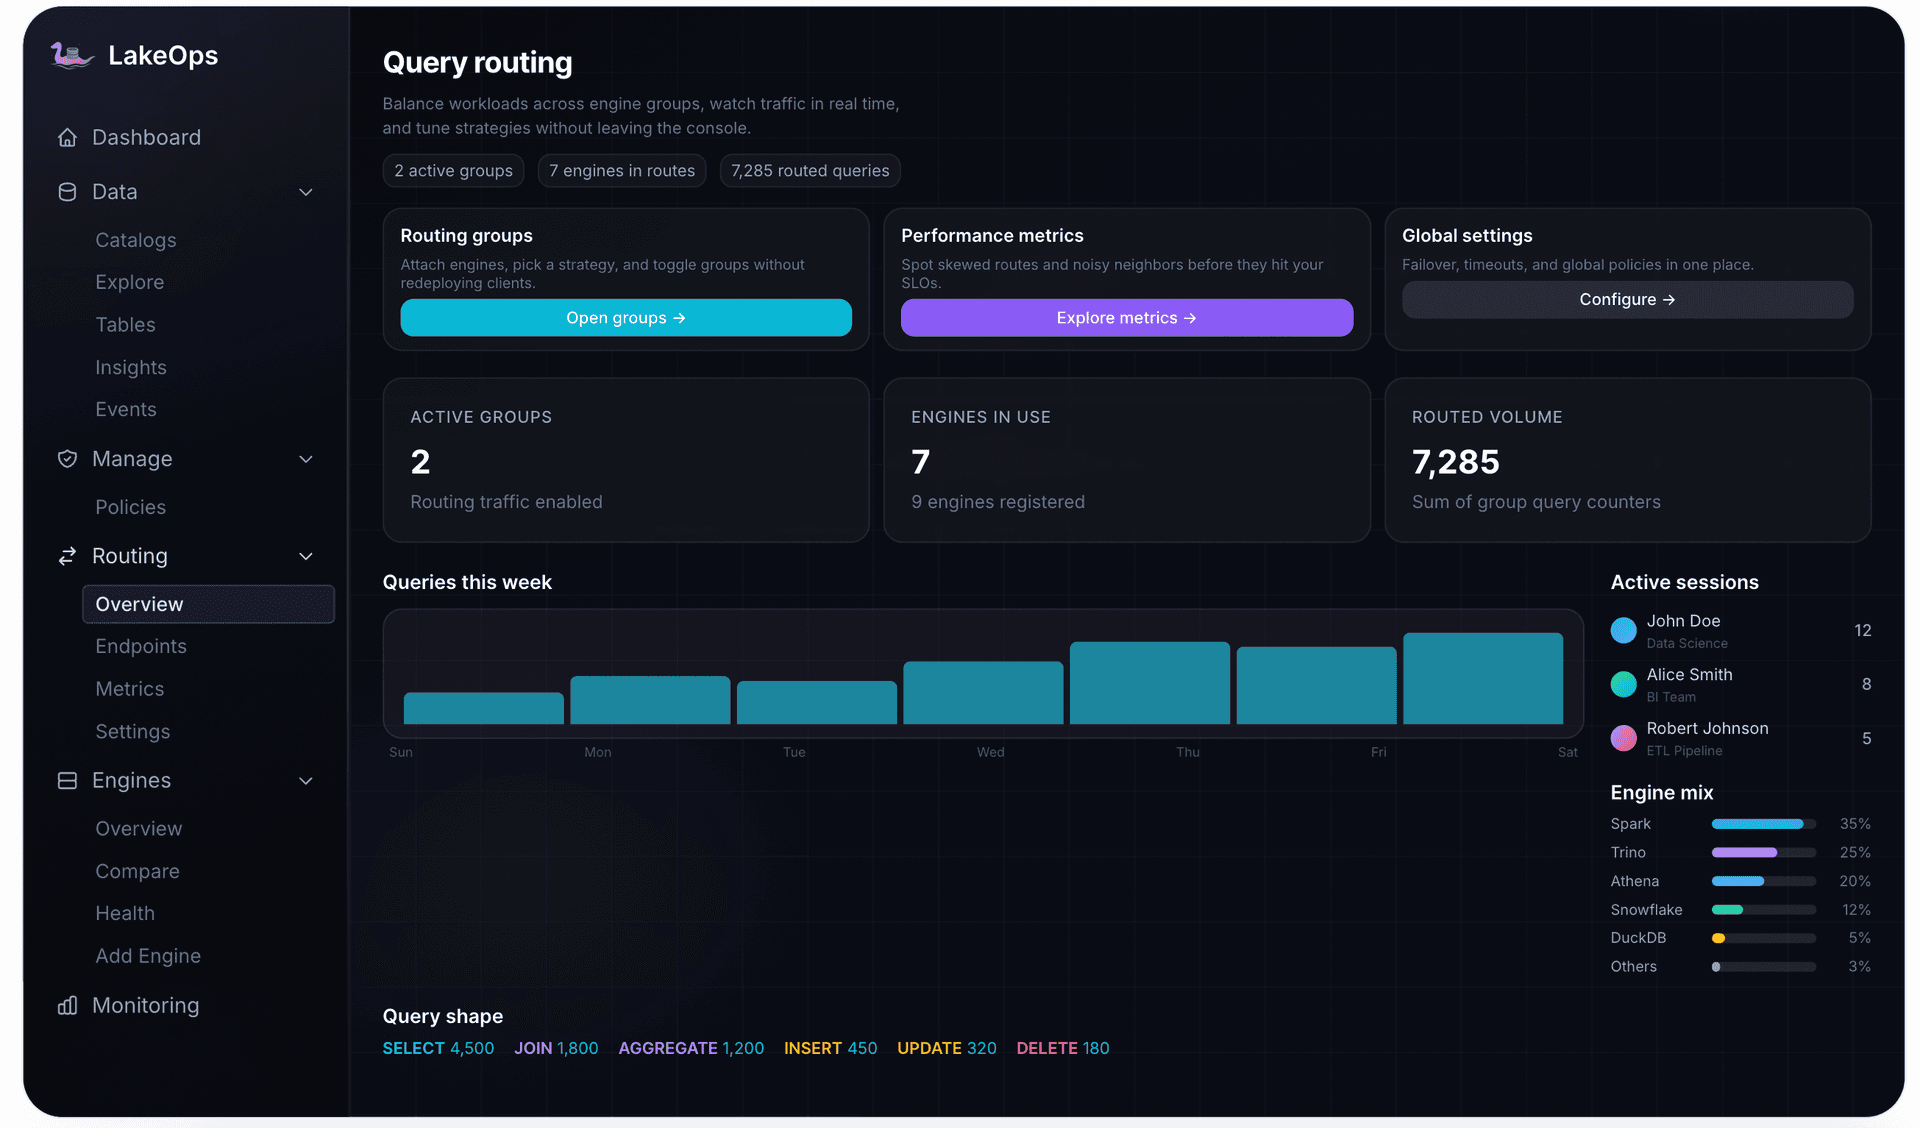
Production lakehouses rarely use a single engine. Trino for interactive analytics, Snowflake for BI, Athena for ad-hoc exploration, DuckDB for lightweight lookups, Spark for batch ETL. Without routing, each team picks the engine they know — regardless of whether it is the cheapest or fastest for that query shape.
LakeOps query routing dispatches each query to the optimal engine based on query shape, latency targets, cost ceilings, and engine availability. Each workload gets a named routing group with capacity limits, fallback rules, and SLA targets. Applications connect to a single SQL endpoint; the routing layer handles engine selection transparently.
The routing layer and maintenance layer form a reinforcing loop. Compaction and sorting unlock cheaper engines for more query shapes — a well-sorted table can serve lookups from DuckDB that a fragmented table would route to Spark. Routing telemetry feeds back into compaction decisions — knowing which queries hit which tables informs sort-order selection. Both improve simultaneously.
Cost optimization as a compound effect
Storage waste from orphan files, snapshot-pinned data, and over-provisioned layouts accumulates silently. Compute waste from scanning fragmented tables, reading unnecessary files, and running compaction on JVM-based clusters compounds monthly.
LakeOps continuously reclaims storage waste through automated lifecycle management — expiration, orphan cleanup, and efficient compaction. A dedicated execution engine eliminates Spark cluster costs. Query routing moves workloads to optimal pricing models. Sort-order optimization reduces the data every query scans. The compound effect across these layers — not any single optimization — is how production deployments achieve significant cost reduction.
Agentic AI readiness
AI agents and LLM-based analytics are becoming primary consumers of SQL infrastructure. They issue queries iteratively inside tool-use loops, run the same query shapes with different parameters on each reasoning step, generate unpredictable access patterns, and need sub-second latency from tables that were designed for scheduled batch workloads. A degraded lake — fragmented files, stale statistics, unbounded scan times — breaks these requirements silently. The agent does not file a ticket. It just returns wrong or incomplete answers.
The operational control plane ensures every table is continuously optimized for the access patterns AI agents use — which is critical because those patterns change with every prompt. connecting AI agents to Iceberg via MCP enable agents to discover table schemas, understand column semantics, and issue governed queries without custom integration code. Layered guardrails enforce safety at the query level: read-only restrictions prevent agents from mutating production data, cost ceilings prevent runaway scans, PII masking protects sensitive columns, and human-in-the-loop approval gates high-stakes operations.
The compaction engine continuously reshapes file layout based on actual query patterns — including agent queries. As AI adoption scales, making your Iceberg lakehouse AI-ready means the lake self-optimizes for whatever agents are asking, without dedicated engineering effort. This is why the operational control plane and the catalog control plane are jointly necessary: the catalog enforces who can access data (including which agent identity), while the operational layer ensures the data is physically ready to be accessed at the speed agents require.
Who else claims to be an Iceberg control plane
The term is used loosely, and understanding what each category actually provides helps navigate vendor claims.
Catalog vendors (Polaris, Glue, Unity, Gravitino, Nessie) call themselves control planes because they control metadata access, credential vending, and commit coordination. This is accurate for the catalog layer. None of them monitor table health, execute maintenance, or optimize file layouts. Apache Polaris explicitly states that compaction, snapshot expiration, orphan cleanup, and manifest optimization remain the user's responsibility.
Warehouse-managed Iceberg (Databricks Predictive Optimization, Snowflake managed compaction) runs basic maintenance on tables managed within their platform. The limitation is scope: these features work only on tables created and owned by that vendor's engine. If you run Trino alongside Snowflake, or Spark alongside Databricks, the tables served by the other engines are not maintained. Cross-engine telemetry is not collected. Sort optimization is based on single-engine access patterns.
Catalog-adjacent maintenance tools (Floe + Polaris, custom Airflow DAGs with health checks) add health evaluation and policy-driven scheduling on top of a catalog. Execution still happens on Spark or Trino — general-purpose engines with JVM overhead, OOM risk, and cluster provisioning costs. They solve the scheduling and sequencing problem but not the execution-engine or cross-engine telemetry problems.
Managed compaction services (AWS S3 Tables compaction) provide background compaction for specific storage tiers. The scope is limited to a single storage API — no cross-catalog management, no sort optimization, no policy governance, no multi-engine routing.
A full operational control plane (LakeOps) covers all five gaps: lake-wide health classification, sequenced maintenance on a purpose-built engine, query-aware sort optimization from cross-engine telemetry, hierarchical policy governance, and multi-engine query routing. It works across every catalog and engine without requiring data to live in any particular vendor's platform.
How to evaluate an Iceberg control plane
When evaluating control plane options for your Iceberg deployment, the checklist splits along the two layers:
Catalog control plane (metadata and auth):
- Does it implement the Iceberg REST Catalog specification?
- Does it support credential vending with short-lived, scoped tokens?
- Does it provide fine-grained access control at the table and column level?
- Does it support the catalogs and engines you run today?
- Can you migrate between implementations without changing engine configurations?
Operational control plane (health and optimization):
- Does it provide lake-wide health classification — every table scored and prioritized?
- Does it execute maintenance in correct dependency order (expire → orphans → compact → manifests)?
- Does cadence adapt to each table's write pattern, or is it schedule-based?
- Does compaction learn from query patterns, or is it static bin-pack?
- Are policies hierarchical (org → catalog → namespace → table) with automatic inheritance?
- Is there a structured audit trail for every maintenance operation?
- Does it work with your existing catalogs and engines without data movement?
- Can you disconnect it without leaving proprietary artifacts in your tables?
Red flags when evaluating:
- The tool requires data to live in a specific vendor's storage or format — that is a managed service, not a control plane.
- Maintenance only works on tables created by one engine — you lose coverage whenever workloads span multiple engines.
- Compaction runs on Spark or Trino — you pay general-purpose compute costs for a narrow I/O operation.
- Sort optimization requires manual column configuration — the tool does not learn from actual query patterns.
- Policies cannot be inherited hierarchically — every table must be configured individually.
- No structured audit trail — you cannot prove what ran, when, and what changed.
- Disconnecting the tool leaves proprietary metadata or requires a migration — you are locked in.
LakeOps operates with three guarantees: no data movement, no code changes, and no vendor lock-in. Everything produced is standard Iceberg — snapshots, manifests, data files, statistics. Disconnect the control plane and your tables remain exactly as they are. No proprietary formats, no migration required, no exit cost.
Scripts, catalogs, and control planes: where each fits
Most teams progress through three stages of Iceberg operational maturity:
- Stage 1: Scripts. Hand-rolled Spark jobs and Airflow DAGs calling Iceberg maintenance procedures. You encode the right operations at authoring time:
expire_snapshots,remove_orphan_files,rewrite_data_files,rewrite_manifests. This works at fewer than 50 tables with stable write patterns. It breaks when table count grows (linear configuration effort), write patterns diverge (a streaming table needs different cadence than a batch table), or the engineer who wrote the DAGs leaves the team. - Stage 2: Catalog control plane. A REST-compatible catalog (Polaris, Glue, Unity, Gravitino, Nessie, Lakekeeper) handles metadata resolution, credential vending, and access control. Engines interoperate cleanly through a standard protocol. Multi-table commits and scan-based governance become possible. But table health is still unmonitored and maintenance is still manual or script-driven — the catalog does not know whether a table is degraded.
- Stage 3: Operational control plane. An autonomous layer monitors every table's health, executes the full maintenance lifecycle in correct sequence, adapts to each table's workload, optimizes sort order from cross-engine query patterns, enforces policies hierarchically, and provides lake-wide observability with per-table audit trails. Engineering shifts from running maintenance to reviewing outcomes. New tables inherit correct policies automatically. The system improves with every cycle.
Stage 2 is necessary but not sufficient. The catalog solves the metadata and governance problem. The operational control plane solves the health and optimization problem. Production deployments need both — and the gap between the two is where most of the operational cost and engineering pain lives.
For the full breakdown of what a modern operational control plane looks like in practice — the nine components of a managed Iceberg data lake — read the companion deep dive.
Getting started
If you have read this far and recognize the operational gap in your own deployment, the fastest way to close it is to connect your catalogs to LakeOps for a managed lakehouse experience. AWS Glue, Polaris, Nessie, Gravitino, Lakekeeper, and S3 Tables are all supported. The setup takes roughly ten minutes and requires no agents, no data movement, and no pipeline changes. Health classification begins immediately across every table in every connected catalog.
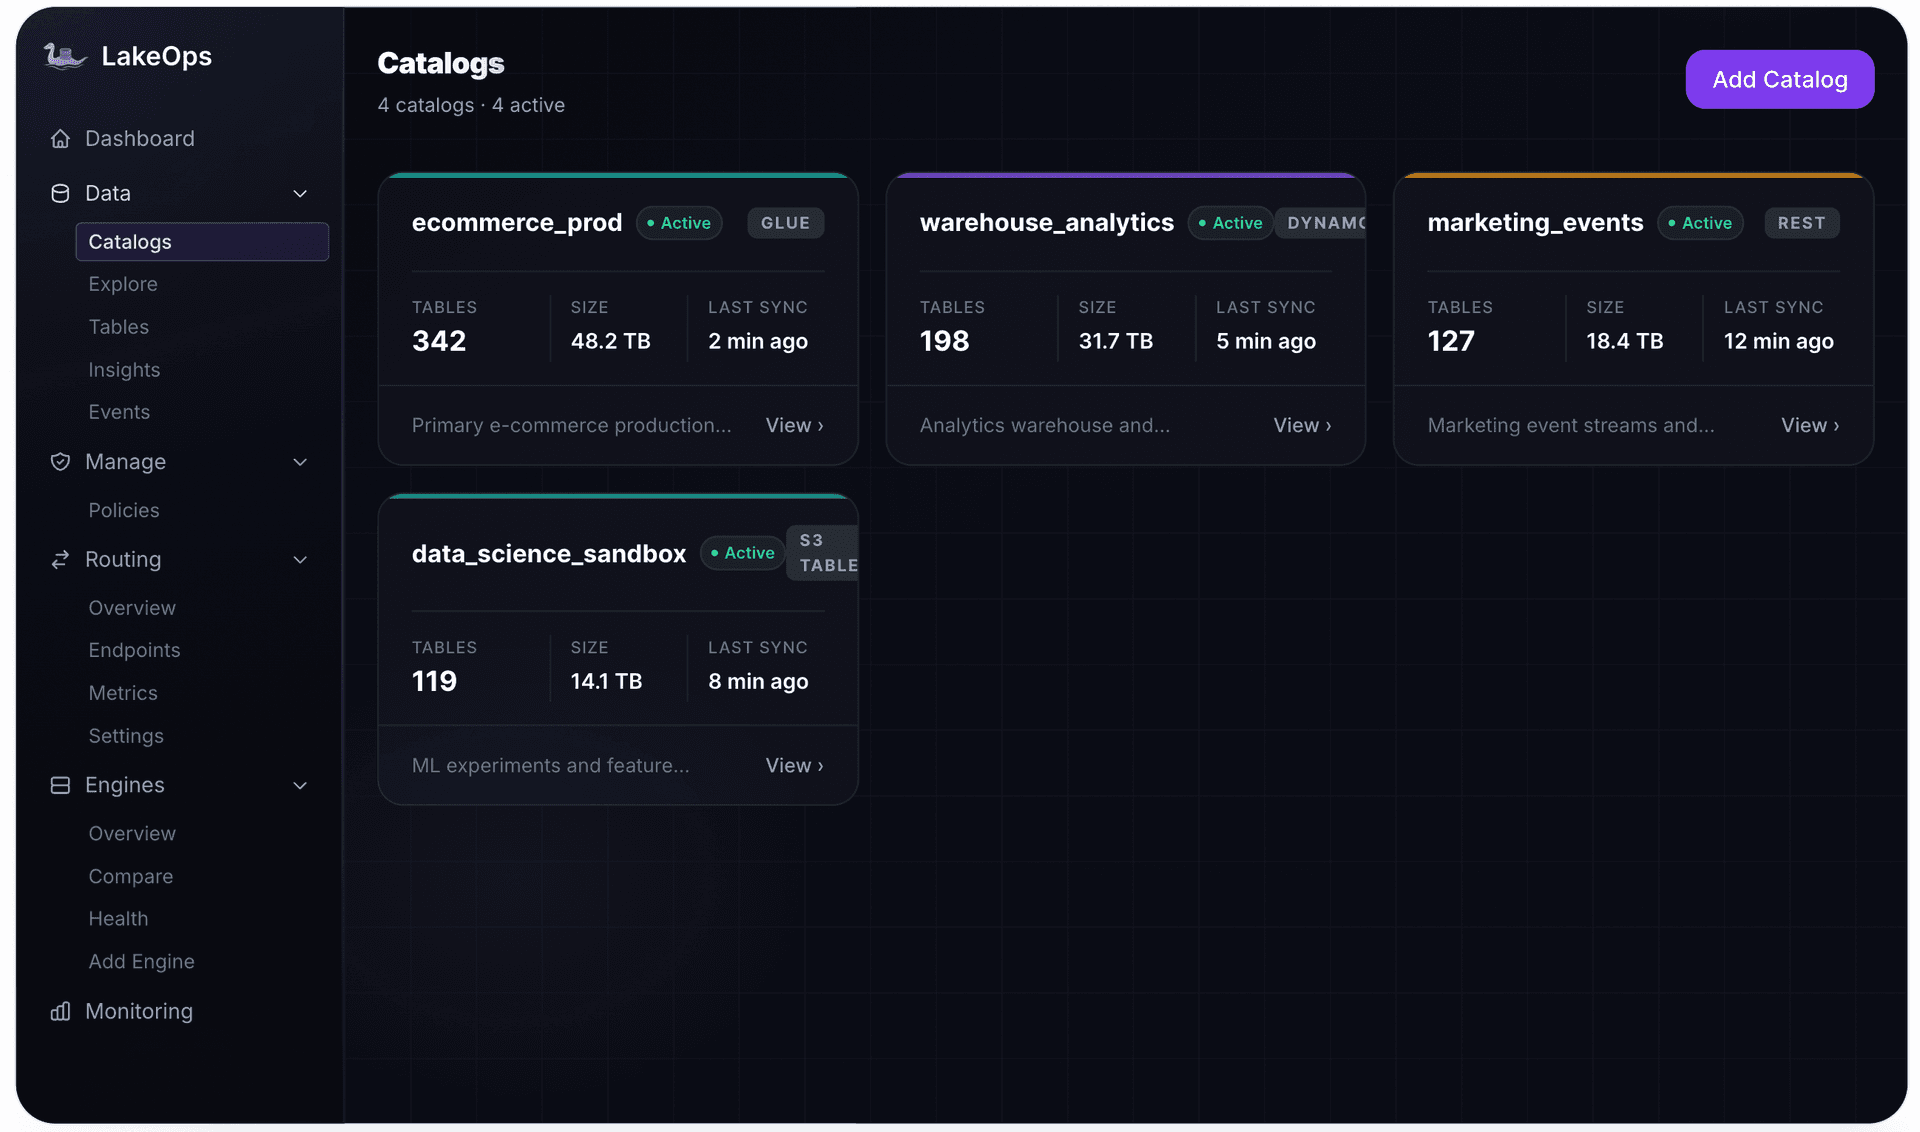
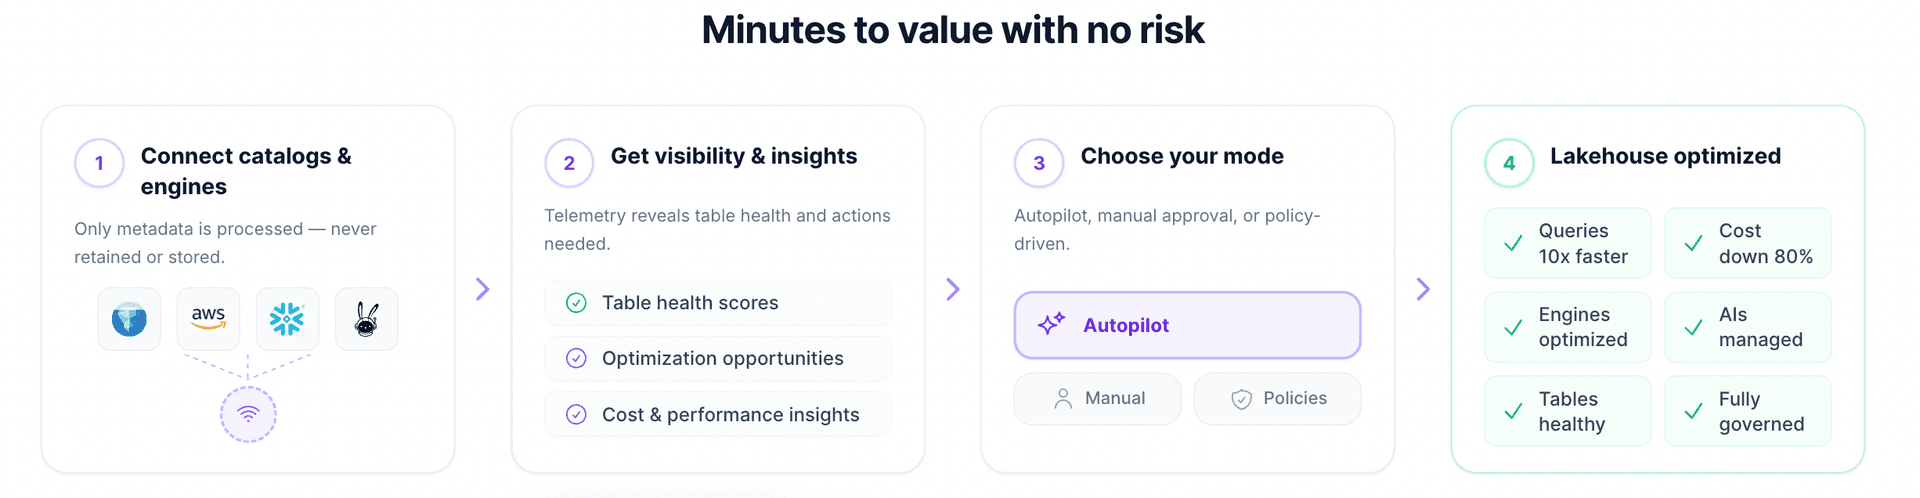
Start in manual-approval mode where operations are recommended but require sign-off. Define policies at the namespace level. Enable autonomous mode once confidence is established. Connect engines for cross-engine telemetry — sort optimization and query routing unlock automatically.
The lake becomes self-maintaining. New tables inherit policies. Degraded tables get immediate attention. Healthy tables cost nothing. The catalog handles metadata and access. LakeOps handles everything after — keeping every Iceberg table in your lake healthy, compact, and query-ready.
Further reading
- What Is a Data Lakehouse Control Plane? — the concept explained from the ground up, with the sense → classify → plan → execute → learn loop
- Iceberg Lakehouse Optimization with LakeOps — step-by-step walkthrough from catalog connection to autonomous optimization
- Apache Iceberg Table Health and Maintenance — metrics, operations, and the checklist for production readiness
- Optimizing Iceberg Lakehouse Performance — six-layer performance optimization guide