

AI agents run up a Snowflake bill in a way people don't. An analyst writes a query, reads the result, and thinks. An agent lists schemas, samples tables, writes SQL, hits an error, rewrites it, and fans out parallel tool calls, all within seconds, on a warehouse that bills per second with a 60-second minimum every time it resumes. The SQL is generated, so it scans more than it needs to. It changes on every attempt, so the result cache rarely helps.
Snowflake has real controls for this: dedicated warehouses, statement timeouts, resource monitors, budgets, and, since November 11, 2026, per-user quotas with role-based scope and overrides. Use them. But they act on a warehouse or a spending cycle, mostly after the credits are spent.
To actually stop agents from running up the bill, you need a control point that every agent query passes through before it reaches a warehouse. It has to know which agent is asking, what the query looks like, whether it already ran, and where it should run. And the tables underneath have to stay cheap to read, so the queries that do run scan as little as possible, whether on Snowflake or on a cheaper engine reading the same Apache Iceberg tables. This guide covers both halves.
Where agent cost control has to live
The usual first reaction to an agent-driven bill is to shrink the warehouse and lower the timeout. That helps, but it treats the warehouse as the unit of control, and a warehouse can't tell an agent's tenth retry from a dashboard refresh. Agent cost is decided upstream of the warehouse, in two places: the query path, where each statement is admitted or refused, and the tables, which set how much an admitted statement has to read.
Covering both places is the job of a lakehouse control plane, and it is how LakeOps is built. The short version:
- What it is. A control layer between your agents, your query engines, and your Apache Iceberg tables. It doesn't replace Snowflake or move your data.
- The query path. QueryFlux, the open-source SQL proxy the LakeOps team maintains, gives agents one endpoint over MCP or any SQL driver. Before a query reaches an engine, it checks who is asking, denies expensive shapes, serves repeats from cache, routes the query, and caps concurrency.
- The table loop. LakeOps reads the Iceberg metadata of every table, scores its health, and runs maintenance in place when table state calls for it, with policies that cover new tables and layout simulations before rewrites.
- Why not scripts. A cron job and a few Spark procedures compact on a timer and see nothing else. A control plane senses continuously, acts when a table or a query needs it, works across every catalog and engine, and records every decision.
- What you get. Agent spend bounded before it happens instead of explained afterwards, cost per agent and conversation, cheaper engines for agent reads over the same tables, and tables that stay cheap to scan.
- Why you need it. Snowflake's controls see warehouses and billing cycles. Agents create cost per query and per conversation, in seconds. Something has to decide at that grain.

Why agent traffic costs more than human traffic
Snowflake bills a warehouse per second while it runs, with a minimum of 60 seconds each time it starts or resumes, and each size step roughly doubles the rate. Queries don't pay for themselves; running time does. So the shape of a workload matters as much as its volume, and agent workloads have a distinctive shape.
| Behavior | What the agent does | What it costs on Snowflake |
|---|---|---|
| Schema exploration | Lists schemas, describes tables, samples with SELECT * ... LIMIT 10 | A burst of small queries, each resuming the warehouse or extending its run |
| Iterative refinement | Runs a query, reads the result, rewrites it | Every rewrite is new SQL text, so the result cache misses |
| Error retries | Retries after syntax, type, or permission errors | Failed queries bill warehouse time up to the failure |
| Unbounded scans | Skips filters, selects every column, joins fact tables without a date range | Full scans of the biggest tables, the expensive tail of the bill |
| Fan-out | Frameworks issue tool calls in parallel | Concurrency spikes that queue, or start extra clusters that each bill |
| Long sessions | Stays connected for hours and queries sporadically | Queries arrive just often enough to reset the auto-suspend timer |
The last row is the quiet one. With AUTO_SUSPEND = 300, one query every four minutes keeps a warehouse running all day. People rarely query on that rhythm; a monitoring agent or an always-on assistant does exactly that. Lowering auto-suspend to 60 seconds trades idle time for more resumes, and each resume bills a full minute.
Two more things make agents expensive on Snowflake specifically. Snowflake reuses a persisted result only for identical query text against unchanged data, and generated SQL varies in aliases, literals, and column order, so the result cache rarely helps. And agents built on Cortex run two meters: AI credits per token for the model, and warehouse credits for the SQL their tools run. Most of Snowflake's newest agent controls govern the first meter.
What Snowflake's native controls do, and where they stop
These controls are the right baseline; everything later in this guide builds on them.
| Control | Scope | When it acts | What it misses for agents |
|---|---|---|---|
Dedicated warehouse with AUTO_SUSPEND | One warehouse | Continuously | Isolates agent spend, but can't tell agents apart or refuse a bad query |
STATEMENT_TIMEOUT_IN_SECONDS | Account, user, session, or warehouse | When a running statement exceeds the limit | Caps the worst query, but the credits up to the timeout are already spent |
| Resource monitors | Warehouses | At credit thresholds, optionally suspending | All or nothing: suspending the agent warehouse stops every agent. No coverage of serverless or AI features |
| Budgets | Account or groups of objects | Notifications against a monthly limit | Alerts, not enforcement |
| Per-user quotas | Users by tag, direct role grant, or name | AI domains within minutes; warehouse usage after credit attribution, which can take hours | The built-in block covers AI domains only |
| Cortex AI Gateway (preview) | AI inference and MCP tool calls through the gateway | Per request, with usage history, budgets, and quotas | Governs tokens, not the warehouse SQL an agent's tools run |
Per-user quotas deserve a closer look, because they are new and they are the closest thing Snowflake has to an agent budget. A quota selects users by tag, by directly granted role, or by name, and sets daily, weekly, or monthly credit limits. The November 11 release added role-based scope and per-user overrides that can expire:
1-- Scope a quota to every user directly granted the AGENT role2CALL agent_quota!SET_QUOTA_USER_SCOPE(PARSE_JSON('{3 "applies_to": {"type": "GROUP_OF_USERS", "roles": ["AGENT"]}4}'));5 6-- Count warehouse compute on the agent warehouse7CALL agent_quota!ADD_SHARED_RESOURCE(8 'WAREHOUSE',9 (SELECT SYSTEM$REFERENCE('WAREHOUSE', 'AGENT_WH'))10);11 12-- Give one agent more monthly headroom until December 113CALL agent_quota!SET_USER_QUOTA_OVERRIDE(['SUPPORT_AGENT'], 300, 'MONTHLY', '2026-12-01');Read the limitations before you rely on quotas for agents:
- One quota, one meter. A quota monitors warehouse compute or AI domains, never both, so an agent that uses Cortex and runs SQL needs two.
- Blocking covers AI domains only. Warehouse quotas get notifications and custom actions, and custom actions run only on the monthly cycle.
- Warehouse usage arrives late, after credit attribution, which can be hours after a query finishes.
- Limits never pool. Each user is evaluated alone, so ten agents on a 100-credit quota can spend 1,000 between them.
- Scale limits. At most 200 overrides per quota, and roles select only users granted them directly.
In practice, a per-user quota is an accurate monthly guardrail for warehouse spend and a fast one for AI spend. It can't stop an agent's warehouse queries this afternoon.
Set up the baseline anyway. A dedicated small warehouse with tight timeouts is the cheapest insurance there is. Size the numbers from your own measurements in the next section:
1CREATE WAREHOUSE IF NOT EXISTS agent_wh WITH2 WAREHOUSE_SIZE = 'XSMALL'3 AUTO_SUSPEND = 604 AUTO_RESUME = TRUE5 INITIALLY_SUSPENDED = TRUE6 STATEMENT_TIMEOUT_IN_SECONDS = 1207 STATEMENT_QUEUED_TIMEOUT_IN_SECONDS = 60;8 9CREATE RESOURCE MONITOR agent_rm WITH10 CREDIT_QUOTA = 2011 FREQUENCY = DAILY12 START_TIMESTAMP = IMMEDIATELY13 TRIGGERS14 ON 75 PERCENT DO NOTIFY15 ON 100 PERCENT DO SUSPEND;16 17ALTER WAREHOUSE agent_wh SET RESOURCE_MONITOR = agent_rm;18ALTER USER support_agent SET DEFAULT_WAREHOUSE = 'AGENT_WH';Prefer SUSPEND over SUSPEND_IMMEDIATE for agents: a cancelled query is wasted spend the agent will retry. And keep agents off interactive warehouses, which bill 60 minutes every time they start.
Then notice what none of these controls can do. None of them knows which agent, conversation, or step produced a query. None of them can say "this query has no date filter on a fact table, rewrite it." And none of them can send a query somewhere cheaper. Those decisions have to happen before Snowflake sees the statement.
Measure what each agent actually costs
Before capping anything, find out where agent credits go. Give every agent its own Snowflake user, or at least its own query tag. Three checks then answer most questions. ACCOUNT_USAGE views lag by up to a few hours, so run them on yesterday's data, not the last five minutes.
Credits per agent. `QUERY_ATTRIBUTION_HISTORY` attributes warehouse compute to each query, excluding idle time:
1SELECT2 user_name,3 COUNT(*) AS queries,4 COUNT(DISTINCT query_parameterized_hash) AS distinct_shapes,5 SUM(credits_attributed_compute) AS credits6FROM SNOWFLAKE.ACCOUNT_USAGE.QUERY_ATTRIBUTION_HISTORY7WHERE warehouse_name = 'AGENT_WH'8 AND start_time >= DATEADD(day, -7, CURRENT_DATE)9GROUP BY user_name10ORDER BY credits DESC;Compare queries with distinct_shapes. A large gap means the agent runs the same query shapes over and over with different literals. That is a caching and prompt-design opportunity, not a warehouse-size problem.
Idle cost. Attribution leaves out idle time, and idle time is exactly what sporadic agent traffic creates. For the agent warehouse, subtract the week's credits_attributed_compute from QUERY_ATTRIBUTION_HISTORY from its credits_used_compute in WAREHOUSE_METERING_HISTORY. If idle credits rival query credits, the agent's rhythm is the problem: it queries just often enough to keep the warehouse warm. The fix is batching, caching, or an engine that doesn't bill idle minutes, not a smaller warehouse.
Scan shape. QUERY_HISTORY records how much of each table a query read. Generated SQL that prunes nothing stands out:
1SELECT2 user_name,3 query_parameterized_hash,4 COUNT(*) AS runs,5 AVG(partitions_scanned / NULLIF(partitions_total, 0)) AS avg_scan_ratio,6 SUM(bytes_scanned) / POWER(1024, 3) AS gb_scanned,7 ANY_VALUE(LEFT(query_text, 200)) AS sample_sql8FROM SNOWFLAKE.ACCOUNT_USAGE.QUERY_HISTORY9WHERE warehouse_name = 'AGENT_WH'10 AND start_time >= DATEADD(day, -7, CURRENT_DATE)11 AND execution_status = 'SUCCESS'12GROUP BY user_name, query_parameterized_hash13HAVING AVG(partitions_scanned / NULLIF(partitions_total, 0)) > 0.814ORDER BY gb_scanned DESC15LIMIT 50;Query shapes that read most of a table's micro-partitions on every run are your guardrail targets. The cause is usually a missing date filter, SELECT * on a wide table, or a join that should have filtered first. Keep the list; the next section turns it into rules. And if agents share a service account, all of this collapses into one user, so keep a separate identity per agent all the way to the warehouse.
Put a control point in the query path
Everything Snowflake can't do here has to happen in a layer the agent passes through before the warehouse. QueryFlux is built for that position. Agents connect over MCP, or over the Snowflake, Trino, or PostgreSQL protocols, and QueryFlux decides what happens to each query before any engine runs it. Its measured overhead is well under a millisecond at the median.
Every query goes through the same steps, in order:
- 1.Identify the agent, conversation, and step.
- 2.Check guardrails, denying expensive shapes with a reason the agent can act on.
- 3.Reuse a cached result if the same identity ran the same query.
- 4.Place the query in the cluster group that should answer it, queueing if the group is full.
- 5.Record the query, its route, its timing, and every guard decision.
Here is a configuration for a set of agents that query Iceberg tables on Trino by default, keep Snowflake available for what only Snowflake has, and leave BI traffic where it is. Connection details are trimmed:
1queryflux:2 frontends:3 mcp:4 enabled: true5 port: 88116 persistence:7 type: postgres8 url: postgres://queryflux:${QF_DB_PASSWORD}@qf-db:5432/queryflux9 cacheBackend:10 scheme: s311 options:12 bucket: queryflux-cache13 region: us-east-114 15auth:16 provider: oidc17 required: true18 oidc:19 issuer: https://idp.internal/realms/data20 audience: queryflux21 22clusters:23 snowflake:24 engine: adbc25 driver: snowflake26 uri: svc_queryflux@myaccount/analytics/public27 auth:28 type: keyPair29 username: SVC_QUERYFLUX30 privateKeyPem: "${SNOWFLAKE_PRIVATE_KEY}"31 queryAuth:32 type: tokenExchange33 variants:34 - name: agents35 overrides:36 warehouse: AGENT_WH37 - name: bi38 overrides:39 warehouse: BI_WH40 trino-lake:41 engine: trino42 endpoint: https://trino.internal:844343 44clusterGroups:45 agents-lake:46 members: [trino-lake]47 maxRunningQueries: 2048 cache: { enabled: true, ttlSecs: 300, maxEntrySizeMb: 64 }49 authorization:50 allowGroups: [agents]51 agents-snowflake:52 members: ["snowflake::agents"]53 maxRunningQueries: 454 authorization:55 allowGroups: [agents-snowflake]56 bi:57 members: ["snowflake::bi"]58 maxRunningQueries: 5059 60routers:61 - type: protocolBased62 mcp: agents-lake63 64routingFallback: biAgent queries over MCP land in agents-lake by default. An agent that needs Snowflake-only data passes engine_hint: agents-snowflake on the tool call, and the allow-list decides whether that identity may use that group at all. The cheap path is the default and the expensive path is opt-in, which is the opposite of handing every agent a Snowflake connection string. The routing and cluster groups docs cover the other router types, including header, regex, user, and Python rules.
Keep one identity per agent, all the way to Snowflake
With auth.required: true, every request must authenticate, through OIDC or LDAP. Over MCP, QueryFlux records each query with an agent ID and a conversation ID, which default to the authenticated identity and the MCP session. Step and tool-call IDs are recorded when the client sends them, as headers or as tool parameters; the agent context docs list the fields.
The queryAuth setting decides who Snowflake sees as the user. The default, serviceAccount, sends every query as SVC_QUERYFLUX, so Snowflake's attribution views and per-user quotas see one user. tokenExchange swaps the agent's token for a Snowflake OAuth token, and passthrough forwards a Snowflake login (over the Snowflake HTTP wire only), so QUERY_ATTRIBUTION_HISTORY and quotas keep working per agent. QueryFlux's post on giving agents SQL, not the keys to every engine walks through the full identity setup.
Deny expensive query shapes before dispatch
Guardrails are a chain of checks that run on every query before it reaches an engine. Global guards run first and per-group guards are appended, and the chain stops at the first deny. Here is a chain built from the scan-shape list in the previous section:
1guardrails:2 global:3 - kind: built_in4 name: read_only5 groups:6 agents-lake:7 - kind: built_in8 name: row_limit9 max_rows: 500010 - kind: built_in11 name: require_predicate12 applies_to: ["fct_*", "events.*"]13 agents-snowflake:14 - kind: built_in15 name: row_limit16 max_rows: 100017 - kind: built_in18 name: require_predicate19 - kind: python_script20 timeout_ms: 20021 script: |22 import re23 24 def check(ctx):25 sql = ctx["sql"]26 if re.search(r"select\s+\*", sql, re.I) and re.search(r"\bfct_\w+", sql, re.I):27 return {28 "action": "deny",29 "code": "SELECT_STAR_ON_FACT",30 "reason": "Name the columns you need instead of SELECT * on fct_ tables. "31 "Call describe_table to see them.",32 }33 return None34 - kind: http_webhook35 url: https://agent-budget.internal/check36 timeout_ms: 30037 fail_behavior: denyWhat each guard does, and where it falls short:
read_onlyblocks anything that isn'tSELECT,WITH,SHOW,DESCRIBE, orEXPLAIN, so no agent can run a costlyMERGEorCREATE TABLE AS.row_limitchecks the outermost query: noLIMITgets a recorded warning, and aLIMITabovemax_rowsis denied. It bounds what the agent pulls back, not what the engine scans.require_predicaterejects aSELECTwith noWHEREclause on tables matchingapplies_to, or on every table when the list is empty. It checks that a predicate exists, not that it is selective:WHERE 1 = 1passes. Enforce date ranges in a Python guard.- Python and webhook guards take everything else:
SELECT *on wide tables, unfiltered joins, the per-agent budget below. They receive the SQL, the user, the cluster group, and the agent context.
Write deny reasons as instructions, because the reason is what reaches the agent. QueryFlux documents that the deny reason is passed to MCP agents, while the code and any warnings are not. "Name the columns you need" gets a corrected query; "policy violation" gets the same SQL again. QueryFlux's walk-through of an agent session traced call by call shows what that difference looks like in practice.
Cap concurrency on a small warehouse
maxRunningQueries caps how many queries a cluster group runs at once. Extra queries wait at the proxy instead of starting extra clusters on a multi-cluster warehouse, and with Postgres persistence the cap holds across every QueryFlux replica, so scaling the proxy doesn't scale the spend.
The variants block describes one Snowflake account once and creates a cluster per warehouse (snowflake::agents, snowflake::bi), each with its own cap. A runaway agent can fill its four slots on AGENT_WH and nothing more, while BI_WH keeps its capacity.
One detail matters for the bill. QueryFlux checks cluster health every 30 seconds, and for Snowflake it uses SHOW WAREHOUSES, which doesn't resume a suspended warehouse, but only when the cluster config names a warehouse, as the variants above do. Without one, it falls back to SELECT 1 and can wake the warehouse every 30 seconds. See cluster variants and health checks.
Cache the queries agents repeat
The result cache is a per-group setting. Its key combines the exact SQL text, the authenticated user, bind parameters, the cluster group, and the current catalog and database. Queries that call non-deterministic functions such as CURRENT_TIMESTAMP are never cached. The cache sits in front of capacity checks, so a hit never takes a backend slot and never resumes a warehouse.
Be realistic about what hits. Identical retries, duplicate parallel tool calls, the describe and sample queries an agent re-runs at the start of each conversation, and questions asked on a timer all hit. Rephrased SQL, which is most of what an exploring agent writes, misses. To raise the hit rate, give agents canonical query templates for common questions, so the same question produces the same SQL. Set the TTL from how often the underlying tables commit.
Two open issues are worth knowing: with the cache on, some denials aren't written to history, and guards run twice on a cache miss. That is why the configuration above leaves the cache off on agents-snowflake, where the budget guard lives.
Budgets per agent: a pattern, not a switch
QueryFlux has no built-in credit quota, and an honest budget needs two inputs anyway. The proxy sees query counts in real time; Snowflake knows credits, hours later. The webhook guard in the chain above joins them through a small service you own. QueryFlux posts the guard context to it, including the user and the agent context, and the service answers allow or deny. Two checks cover most of it:
- A real-time counter per conversation. Increment a key for each agent and conversation, with a TTL of a few hours. Past the limit, deny with a reason such as "Summarize what you found and ask the user before running more queries." This stops one conversation from running away this afternoon.
- A nightly credit check per agent. A scheduled job reads credits per user from
QUERY_ATTRIBUTION_HISTORYand flags any agent over its daily allowance, the same number you would put in a per-user quota. While the flag is set, deny with "Query the lakehouse tables instead, or ask a person to approve more." This stops one agent from running away slowly.
Set fail_behavior: deny so a budget service outage fails closed, and keep the guard's timeout short so it doesn't add latency to every query.
Move agent reads off the warehouse
Guardrails make each Snowflake query cheaper. Routing decides whether a query needs Snowflake at all. When the data is in Apache Iceberg, the answer is often no.
Snowflake-managed Iceberg tables use Snowflake as the catalog, and external engines reach them through the Horizon Iceberg REST endpoint. Externally managed tables live in a catalog such as Apache Polaris, and Snowflake reads them, for example through a catalog-linked database; since October 29, 2026, external engines can also read and write externally managed tables through Horizon. Either way, Trino, DuckDB, and Spark read the same Parquet files Snowflake does.

Not every agent query should move. A rough guide:
| Agent query | Good home | Why |
|---|---|---|
| Point lookups and small filtered aggregates on Iceberg tables | DuckDB or a Trino cluster you already run | Small and frequent; no per-resume minimum on capacity you already pay for |
| Exploratory scans of large Iceberg fact tables | Trino on Iceberg, behind guardrails | Pruning depends on table layout, not warehouse size |
| Queries on Snowflake-native tables, secure views, or Cortex functions | Snowflake | The data or the function only exists there |
Moving a query changes how you pay, not whether you pay; the idle-cost check tells you when another engine is actually cheaper.
How the traffic moves depends on how agents connect:
- MCP agents use the default group in the config above. Snowflake becomes an explicit, allow-listed hint.
- Agents built on the Snowflake connector keep their client and point it at QueryFlux's Snowflake frontend. A router picks the group for the session at login, by the warehouse, role, or user the client asks for. See offloading Snowflake queries without changing clients.
Check two things before you switch:
- The SQL has to translate. QueryFlux translates with sqlglot: Snowflake-frontend clients are treated as writing Snowflake SQL, and MCP calls are translated only when the agent passes a
dialect. Translation can turn an error into a silent wrong answer, so replay real agent queries first. - Routing is per session on the Snowflake frontend. Async execution, multiple statements per request,
ALTER SESSION, and server-side cancel are not proxied.
For the table side of the move, see the Snowflake to Iceberg migration guide. For how Snowflake, Trino, Spark, and Athena share the same tables safely, see Iceberg multi-engine architecture.
Cheap queries start with healthy tables
On Iceberg, what an agent query costs depends heavily on the state of the table. Every engine plans a scan by reading the table's metadata files, opens each data file that survives pruning, and merges delete files at read time. Snowflake looks after the micro-partitions of its native tables. The Iceberg tables in your own catalog stay cheap only if someone maintains them.
Four kinds of degradation show up directly in agent cost:
- Small files. Streaming and frequent small writes leave thousands of them, each another file to open and another set of statistics to evaluate, so the same query costs more every week.
- Snapshot and manifest growth. Every commit adds metadata that engines read to plan, so a quick lookup pays for years of unexpired snapshots.
- Delete files. Merge-on-read updates leave delete files every reader must apply. CDC tables, which agents love because they hold current state, accumulate them fastest.
- A layout that doesn't match the filters. Agents filter on time and entity IDs. If the table isn't clustered on those, file statistics can't skip anything.

Check where a table stands with its metadata tables: files, snapshots, manifests, and delete_files. This is Spark SQL; Trino exposes the same tables with a $ suffix, as in "fct_orders$files":
1SELECT2 COUNT(*) AS data_files,3 ROUND(AVG(file_size_in_bytes) / 1048576, 1) AS avg_file_mb,4 SUM(CASE WHEN file_size_in_bytes < 32 * 1048576 THEN 1 ELSE 0 END) AS small_files5FROM lake.analytics.fct_orders.files6WHERE content = 0;Then lay the table out for the way agents filter. Partition on a time transform such as days(order_ts): hidden partitioning means an agent filtering on order_ts still prunes, which generated SQL gets right far more often than a separate partition column. Sort within partitions by the entity IDs agents look up, so file statistics can skip most files. Binpack compaction fixes file counts but clusters nothing, so it is the wrong fix for a layout problem.
1-- Declare the layout once; sort compaction rewrites files to match it2ALTER TABLE lake.analytics.fct_orders WRITE ORDERED BY customer_id, order_ts;3 4CALL lake.system.rewrite_data_files(5 table => 'analytics.fct_orders',6 strategy => 'sort'7);Respect ownership: Snowflake maintains the Iceberg tables it manages, so don't rewrite their files from another engine. For partition design in depth, see Iceberg partitioning best practices.
For twenty tables, scheduled Spark jobs work. For two thousand, written by streams, CDC feeds, and the derived tables agents keep asking for, they don't.
How LakeOps keeps the lake cheap for agents
LakeOps runs that table loop for every table in the catalogs it connects to: AWS Glue, and any Iceberg REST catalog, such as Apache Polaris or Project Nessie. It reads table metadata, never copies data, and runs maintenance in place, in your own storage. Here is the order you'd work through it.
See the whole lake
The dashboard shows how many tables are healthy and how many need attention, what maintenance ran over the last 30 days, and how storage is trending. Against an agent bill, this is the first question: how many of the tables agents read are degraded right now?

Health for every table
Each scan checks a table's metadata against fixed thresholds: excessive snapshots and manifests, partitions made mostly of small files, high delete ratios, skewed partitions, and refs without retention. Each finding becomes an insight with a severity. A table is Critical if it has a critical insight, Warning if it has a warning, and Healthy otherwise.

A record of everything that ran
Every operation is recorded as an event with its table, status, impact, and duration, whether a policy, Adaptive Maintenance, the REST API, or an agent over MCP started it. When an agent query on a table suddenly gets cheaper or more expensive, this is where you check what changed.

Insights that say what to fix
Health says a table is unwell. Insights say why, ranked from Critical down to Info, with the metrics behind each finding. Excessive manifests and partitions of small files are the two that most directly inflate scan planning and file opens for agent queries.

Maintenance triggered by table state
Agent-facing tables don't degrade on a schedule. A backfill or a CDC burst can fragment a table in an afternoon, and a nightly cron either runs where nothing is needed or misses the table that is. Adaptive Maintenance watches each table's signals instead: the share of small files, compactable bytes, snapshot and manifest counts, delete files, and their growth per hour. Due operations run in a fixed order: compaction, snapshot expiry, position-delete rewrites, dangling-delete removal, and manifest rewrites, each with a cooldown. Scheduled mode caps runs to a cron window.

Jobs run on LakeOps-managed compute with a Rust compaction engine built on Apache DataFusion, not on your warehouse. A job reads only the files it rewrites, writes to your bucket, and commits without blocking readers or writers, sorting when the table declares a sort order. The cost optimization page covers where the savings come from.
Compare layouts before rewriting a table
Changing a sort order rewrites files, so compare first. The Simulations tab ranks the current layout against generated candidates for partition spec, sort order, and file size, estimating files scanned, data read, and execution time from metadata. Nothing is written. Today the workload is inferred from column names and types; real query history as the workload is in alpha. Treat the result as a ranking, then apply the winner with ALTER TABLE ... WRITE ORDERED BY.

Policies that cover new tables automatically
Agents make tables multiply: derived tables, feature tables, answer caches. LakeOps policies apply to all catalogs, one catalog, or namespaces and tables matched by name or regex, with exclude lists, and new tables that match a scope inherit its policy when LakeOps discovers them.

The platform overview shows how sensing, planning, and execution fit together across the lake. For the broader component list of a managed lakehouse, see Managed Iceberg in 2026.
Let agents check cost before they query
The cheapest query is one the agent decides not to run. The LakeOps MCP server gives agents read-only tools for that decision:
get_table_scan_cost_hintsreturns full-scan cost signals: file counts, bytes, delete files, snapshot and manifest counts, andcost_signals[]warnings.get_table_profilereturns stats, insights, and maintenance signals in one call.get_partition_distributionshows how files and bytes spread across partitions, so the agent can pick a filter that prunes.
Put it in the agent's instructions: before querying an unfamiliar or large table, call get_table_scan_cost_hints; if it warns, add a partition filter, select fewer columns, or ask the user first. Connecting AI agents to Iceberg over MCP covers setup, and the agentic AI solution page shows how the pieces fit.
Routing in the same console
LakeOps query routing is built on QueryFlux and brings routing groups into the same console as table health. It is in alpha: the routing screens show sample data, and routing itself runs on QueryFlux today.
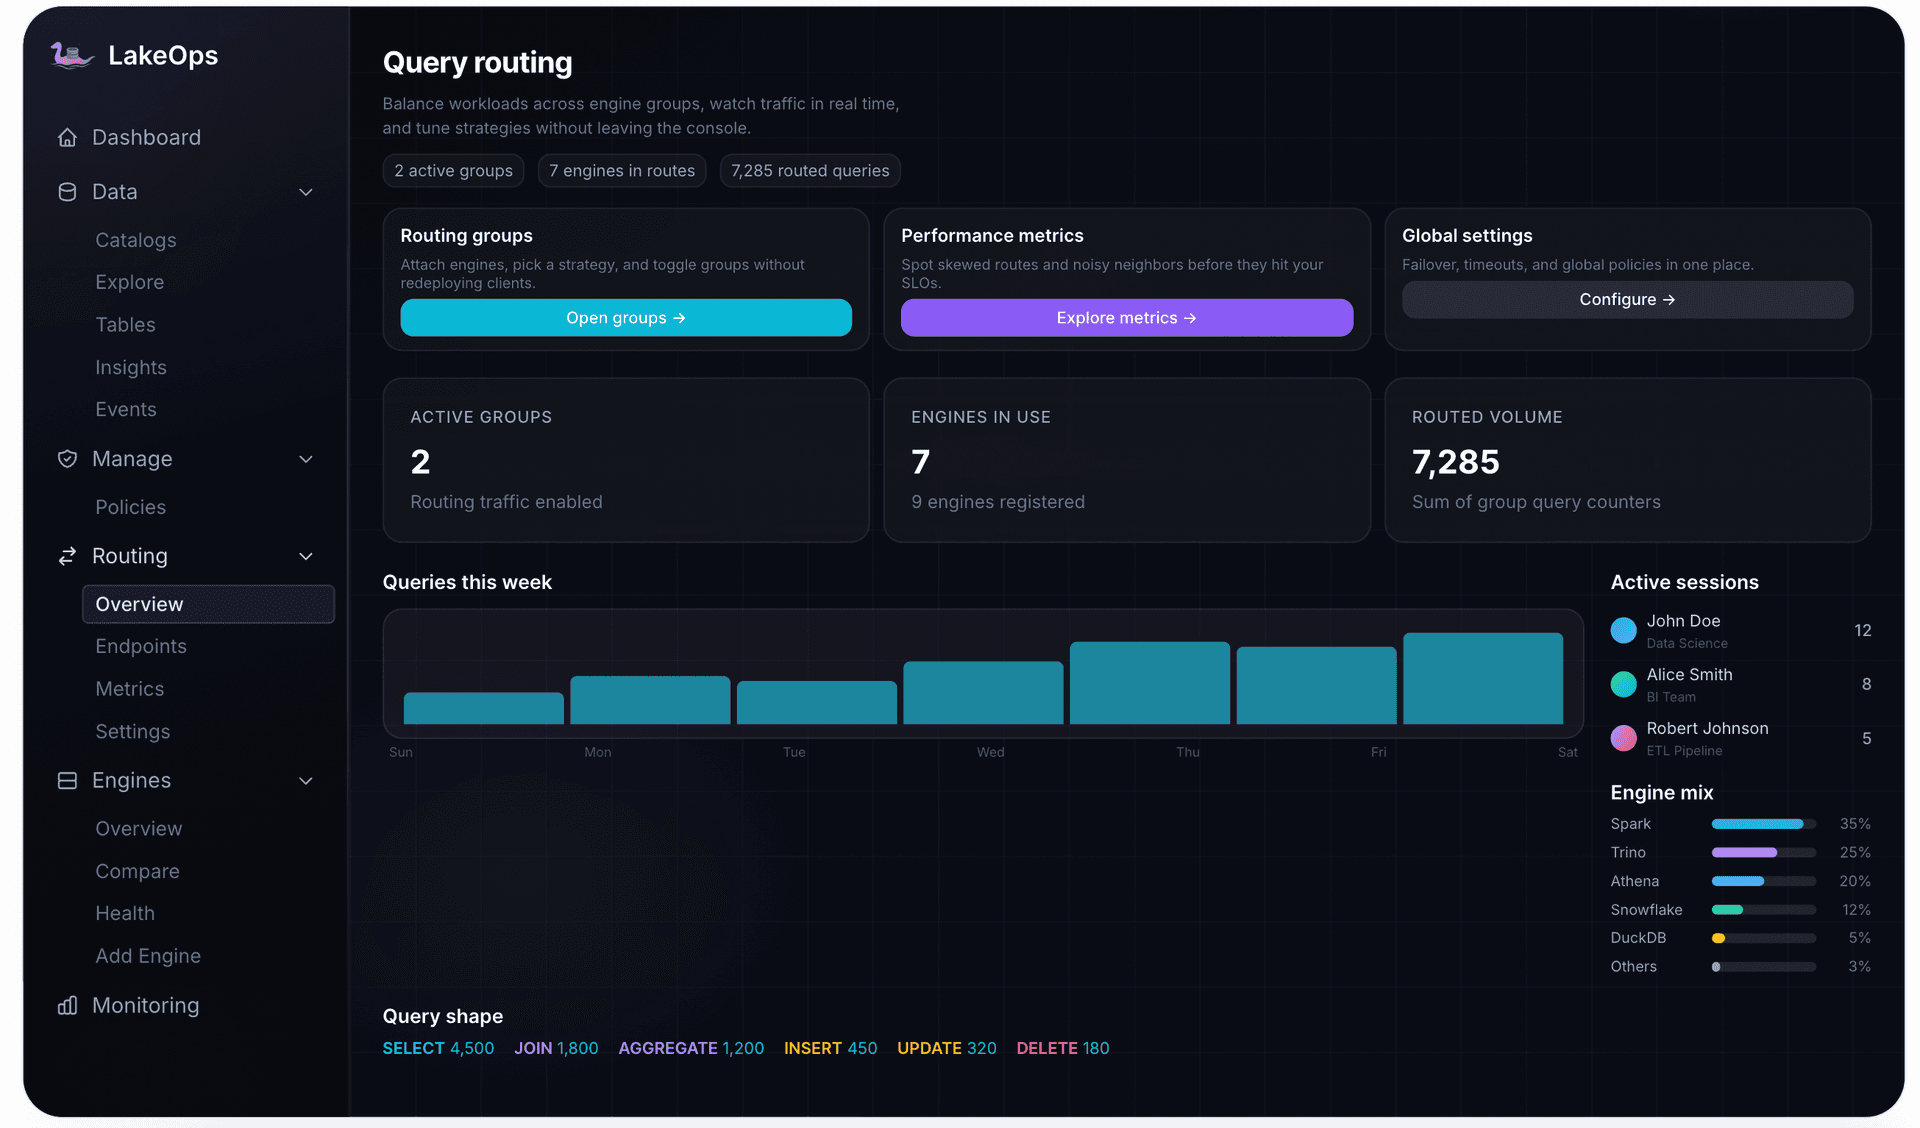
The direction is a closed loop between the two halves of this guide: we're connecting QueryFlux query history to LakeOps, so the columns agents filter and join on shape layout candidates in Simulations. Query routing in LakeOps describes where that is going.
A rollout plan
You don't need all of this on day one. This order pays back fastest:
- 1.Isolate and measure. One Snowflake user per agent, a dedicated
XSMALLwarehouse with timeouts and a resource monitor, and a week of the measurement queries. - 2.Set Snowflake's own limits. Per-user quotas for agent users, with AI-domain blocking if agents use Cortex.
- 3.Put QueryFlux in front of agents. Authentication,
read_only,row_limit, and a concurrency cap, with deny reasons written as instructions. - 4.Turn the scan-shape list into guardrails, then add the budget webhook and the cache where measurements show runaway conversations and repeats.
- 5.Move one agent workload to Iceberg. Pick the one with the most idle credits and the simplest SQL, and replay its queries through translation first.
- 6.Keep the tables cheap. Connect the catalogs to LakeOps, turn on Adaptive Maintenance for the namespaces agents read, and give agents the scan-cost tools.
Spend has to be bounded before it happens
Agents turn the Snowflake bill into a per-query problem, and Snowflake's controls work per warehouse and per cycle. Set those controls up, then add the two layers they can't provide: a query path that decides what reaches the warehouse, and tables that keep every admitted query cheap on whichever engine runs it. If you'd rather not build and run that loop yourself, LakeOps runs it on the Iceberg tables you already have.