
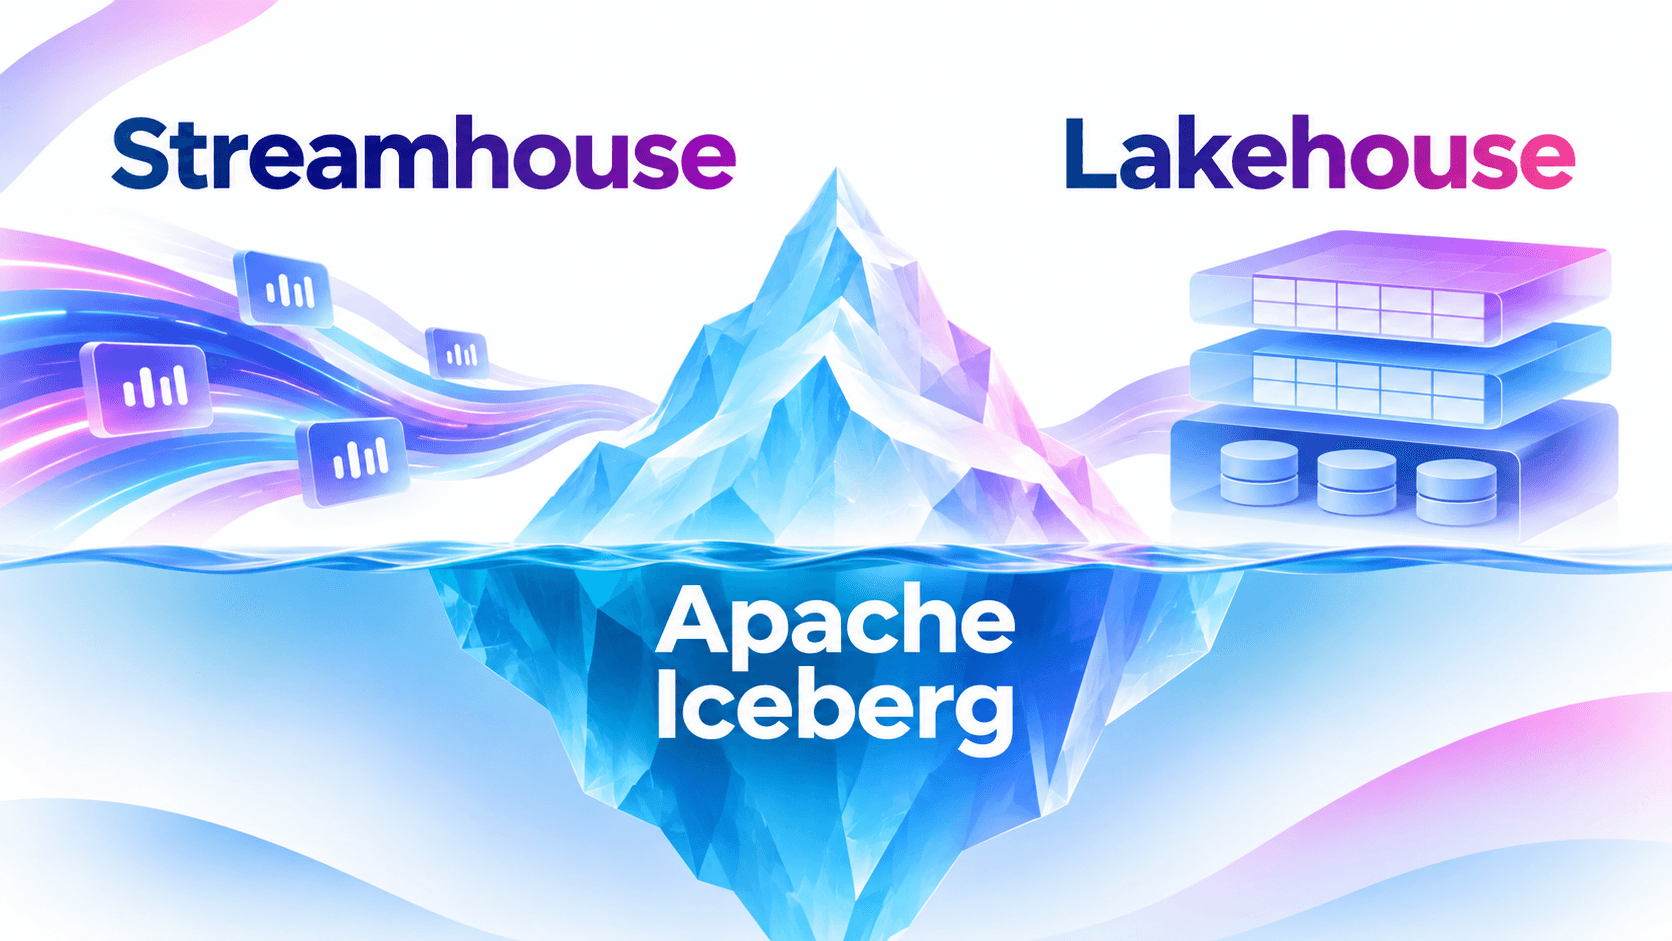
A Streamhouse is an architecture that keeps the current state of a business continuously queryable by applications and AI agents, straight from the event stream. A lakehouse keeps the history of that business on open tables that any engine can query. They are not competing designs. The Streamhouse answers "what is true right now?", and the lakehouse answers every question that needs a join, an aggregate, a trend, or an audit trail. In practice, the line between them is a set of Apache Iceberg tables written at streaming speed.
Confluent made this concrete on November 4, 2026, when it introduced its Streamhouse architecture: Lightning Tables for sub-second lookups on Kafka topics, Snapshot Queries that combine stream history with the live tail, Tableflow to write topics out as Iceberg tables, and a Real-Time Context Engine that hands all of it to agents over MCP. Confluent's own framing, in A Tale of Two Houses, is that the two houses work together, and that long-term history belongs in the lakehouse.
That framing has a consequence that is easy to miss in a launch post. Once an agent's decision path includes an Iceberg table, that table becomes a production dependency with a latency budget. It is written by streaming commits, it changes every few minutes, and it slowly gets worse to read unless something maintains it. The Streamhouse vendors own the live state. Who owns the health of the history?
This guide follows one agent request through a real Streamhouse, maps which Iceberg tables your vendor maintains and which you do, and shows how to run the lakehouse half as a managed service.
The missing layer: a control plane for the lakehouse half
Iceberg standardizes the table format and the catalog API, but nothing in the stack watches every table, decides what each one needs, and acts on it. Streaming platforms maintain the tables they write, engines read what they are pointed at, and catalogs track pointers. Nobody owns the lake as a whole.
That is the job of a lakehouse control plane, and it is what LakeOps is. The mental model is short:
- What it is. An operations layer above your Iceberg catalogs, tables, and engines. It connects to the catalog and storage you already have and never copies your data.
- What it does. One loop on every table: read the Iceberg metadata (snapshots, manifests, file statistics), find what is wrong, decide which maintenance is due and in what order, run it on a Rust engine, and measure again.
- What you get. Lake-wide health and insights, maintenance triggered by table state instead of a clock, policies that respect vendor-maintained tables, layout simulations, a complete event trail, and MCP tools so agents can check a table before trusting it.
- Why a Streamhouse needs it. It puts Iceberg tables in the live decision path, and those tables fail gradually, not loudly. Without an owner, your agents' history reads quietly get slower, costlier, and staler.

If the idea is new to you, this control plane explainer covers its general shape. This guide stays on the Streamhouse case.
What a Streamhouse is, and what it is not
The word comes from the Streamhouse working group formed in September 2026 by Aiven, Confluent, Redpanda, StreamNative, and Ververica. Their definition rests on three properties: real-time (current state is queryable as events arrive), production-native (built for operational systems and agents, not just analysts), and decentralized (domain teams own their streams and tables). Ververica coined the term, and the Apache Fluss community describes a table-centric take where streaming storage tiers into a lake format.
Confluent organizes its version into five pillars: Stream, Connect, Process, Govern, and Query. The first four are the existing Kafka, connector, Flink, and governance stack. Query is the new part, and it is where the lakehouse comes in.
There is fair skepticism too. Conduktor argues the category still lacks shared primitives and guarantees, and others note that materializing topics into Iceberg is lakehouse ingestion under a new name. Here is the working definition I'd use:
> A Streamhouse is a serving contract on current state, built from an event log, stream processing, materialized views, and open tables. Its value is measured by how fresh its answers are, and its weak spot is whatever it hands to the lakehouse.
Streamhouse vs lakehouse: where the boundary sits
Compared on the properties that matter at runtime:
| Dimension | Streamhouse layer | Lakehouse layer (Apache Iceberg) |
|---|---|---|
| Core primitive | A table over the log | A table over files in object storage |
| Question it answers | What is true right now? | What happened, how often, and why? |
| Typical freshness | Sub-second to seconds | Minutes, or the cadence of the job that wrote it |
| Query shape | Key lookups and simple filters on one table | Joins, aggregates, windows, time travel |
| Retention | Bounded by topic retention | Years, bounded by cost and policy |
| How it fails | Lag, consumer backpressure | Gradual: small files, metadata bloat, delete-file overhead |
| Who reads it | Applications, agents mid-decision | Engines, analysts, agents that need context |
The row that matters most is how it fails. A lagging stream sets off alerts. A degrading Iceberg table doesn't: queries slow a little each day, scans cost more, and nobody gets paged.
The two layers meet wherever something writes a stream into Iceberg: Confluent Tableflow, Redpanda Iceberg Topics, StreamNative Ursa, Flink or Kafka Connect Iceberg sinks, or a Fluss tiering service. All of them produce tables that are written constantly and read by other engines.
One agent request through Confluent's Streamhouse
An airline runs a rebooking agent. A flight was just cancelled, and the agent has to decide where to put a passenger. It needs three kinds of answers, and in Confluent's architecture each comes from a different surface.
Lightning Tables: current state, one table at a time
Lightning Tables materialize a Kafka topic into an indexed table you can query directly. Confluent reports data becoming queryable about 100 milliseconds after it arrives, with query latency in the tens of milliseconds, based on its internal testing. The topic's cleanup.policy decides the mode: a compacted topic gives you an upsert table holding the latest value per key, and a delete-policy topic gives you an append table.
The first question is a point lookup: the passenger's current booking, and open seats on the next two departures.
1-- Lightning Tables: single-table lookups on live state2SELECT booking_id, status, flight_id, fare_class3FROM bookings_current4WHERE passenger_id = 'P-88213';5 6SELECT flight_id, seats_open, departure_ts7FROM seat_inventory8WHERE flight_id IN ('LX1420', 'LX1424');The constraints are the point. According to the Lightning Tables query reference, queries are read-only and run against a single table: no joins, aggregates, GROUP BY, or subqueries. That trade buys latency and concurrency; anything needing context lives elsewhere.
Snapshot Queries: the live tail plus Tableflow history
The second question is about the recent past: was this passenger already rebooked today, and did it fail? Snapshot Queries run Flink SQL as a bounded query over a topic, reading Tableflow's materialized history and the Kafka tail together, so you get the full picture as of the moment you ask.
1SET 'sql.snapshot.mode' = 'now';2 3SELECT event_type, flight_id, result, event_ts4FROM rebooking_events5WHERE passenger_id = 'P-88213'6 AND event_ts > CURRENT_TIMESTAMP - INTERVAL '24' HOUR;Snapshot Queries read the current moment, not an arbitrary point in time, and their history comes only from tables Tableflow wrote.
The lakehouse: joins, history, and the audit
The third question decides whether the rebooking is good: given fare rules, loyalty tier, historical misconnect rates on candidate routes, and crew duty limits, which option is best? That is a multi-table join over months of data, run on Trino, Spark, Snowflake, or DuckDB against Iceberg tables, many of them built by your own jobs.
A fourth reader is often forgotten: the incident review asking why the agent made that call, which needs those snapshots to still exist.
| Agent question | Surface | Freshness | Limits |
|---|---|---|---|
| Current booking and open seats | Lightning Tables | About 100 ms (vendor-reported) | Single table, no joins or aggregates |
| What happened to this passenger today | Snapshot Queries | Now, at query time | Current moment only, Tableflow-written history |
| Which option is best, given history and rules | Engines over Iceberg | Whenever each table last committed | Only as fast as the table layout allows |
| Why did the agent decide that | Iceberg time travel | Historical | Only as far back as snapshots are retained |
Two rows depend entirely on the lakehouse, and a third on Tableflow's Iceberg tables. The Streamhouse is fast because it hands everything heavy to Iceberg.
One Streamhouse, several clocks
So one agent decision mixes data with different freshness. Lightning Tables reflect events within about 100 milliseconds. Tableflow commits Iceberg snapshots roughly every five minutes. A Spark job deriving misconnect rates from those snapshots is as fresh as its schedule, and any result cache adds its own TTL.
That is fine until the agent can't tell which clock an answer came from. An agent combining a live seat count with an hours-old crew-duty table should know it, and so should whoever debugs it later. Iceberg records the clock for you: every commit is a timestamped snapshot.
1-- Spark SQL: last commit time, and commits per hour2SELECT max(committed_at) AS last_commit3FROM lake.flight_ops.misconnect_rates.snapshots;4 5SELECT date_trunc('hour', committed_at) AS hour, count(*) AS commits6FROM lake.flight_ops.rebooking_events.snapshots7WHERE committed_at > current_timestamp() - INTERVAL 24 HOURS8GROUP BY 19ORDER BY 1;10 11-- Trino exposes the same metadata as "table$snapshots"12SELECT max(committed_at) FROM flight_ops."misconnect_rates$snapshots";Commit time is not event time. A table can commit every five minutes while still receiving late events, so if completeness matters, track an event-time watermark too. For commit cadence and caching trade-offs inside the lakehouse, see our real-time lakehouse guide.
What Tableflow maintains, and the tables it never touches
Before planning maintenance, sort your tables by who owns them. Most Streamhouse designs skip this step.
Tableflow does real maintenance on the tables it writes. Per the Tableflow configuration docs, it compacts files and expires snapshots automatically, keeping between 10 and 100 snapshots (not configurable), with data retention set by retention_ms, seven days by default. Upsert mode is merge-on-read: updates and deletes produce delete files, which Tableflow compacts.
Storage is either Confluent Managed Storage, accessed through credentials vended by Tableflow's Iceberg REST catalog, or your own bucket on S3, ADLS, or GCS. In both cases the storage docs are explicit: don't modify or delete the objects Tableflow writes. So Tableflow tables are vendor-maintained: you observe them and never rewrite them. Everything else is yours, which in practice is most of what agents join against:
| Writer path | Who maintains the table | What you still own |
|---|---|---|
| Tableflow, managed storage | Confluent: compaction, snapshot expiry, cleanup | Visibility into health and freshness, and how downstream readers are affected |
| Tableflow, your own bucket | Confluent, same as above; don't touch the files | The same, plus storage cost and bucket-level hygiene |
| Redpanda Iceberg Topics | Partly you: Redpanda's tuning guide leaves compaction to external tooling | Compaction, snapshot expiry, and layout |
| Flink or Kafka Connect Iceberg sinks | You | All maintenance, layout, and retention |
| Spark, dbt, or Flink tables derived from streams | You | All maintenance, layout, and retention |
| Dimension, feature, and reference tables | You | All maintenance, layout, and retention |
From the agent's point of view, the tables behind a good decision (misconnect rates, fare rules, loyalty dimensions, crew features) are almost all in the bottom rows. The vendor maintains the raw landing tables. The tables with business meaning are yours.
Why Iceberg tables written at streaming speed degrade
Every Iceberg commit writes new data files, a manifest list, at least one manifest, and a snapshot entry. That is what lets a streaming writer and many readers share a table safely, and it is also why a table written at streaming speed accumulates structure faster than readers can handle efficiently.

Five mechanisms do most of the damage:
- Small files. File count grows with commit frequency times partitions touched per commit times writers. Each extra file is another open, footer read, and scheduled task.
- Snapshot accumulation. Until snapshots expire, files that compaction replaced can't be deleted, and metadata keeps growing.
- Manifest sprawl. Each commit usually writes a small manifest, and planning reads them all, so tiny manifests slow planning even for queries that read little data.
- Delete files. Upsert and CDC streams generate position and equality deletes that readers merge at query time. Equality deletes are the costliest, and dangling deletes that point at rewritten data keep costing planning time until removed.
- Layout drift. Streams write in arrival order, so one flight's rows spread across many files, and even a well-partitioned table can't skip much data for the filters agents use.
You can measure all of this with Iceberg's metadata tables. In Spark SQL:
1-- Data vs delete files, average size, and how many files are small2-- content: 0 = data, 1 = position deletes, 2 = equality deletes3SELECT content,4 count(*) AS files,5 round(avg(file_size_in_bytes) / 1048576, 1) AS avg_mb,6 count_if(file_size_in_bytes < 64 * 1048576) AS small_files7FROM lake.flight_ops.bookings_cdc.files8GROUP BY content;9 10-- Manifest count and how many data files each manifest carries11SELECT count(*) AS manifests,12 round(avg(added_data_files_count + existing_data_files_count), 1)13 AS files_per_manifest14FROM lake.flight_ops.bookings_cdc.manifests;15 16-- Which partitions are fragmenting fastest17SELECT partition,18 count(*) AS files,19 round(avg(file_size_in_bytes) / 1048576, 1) AS avg_mb20FROM lake.flight_ops.bookings_cdc.files21WHERE content = 022GROUP BY partition23ORDER BY files DESC24LIMIT 20;Run those hourly on every table and decide what each result means, and you have rebuilt the sensing half of a control plane by hand.
The maintenance you own, in the right order
For the tables you own, the Iceberg maintenance guide gives you the procedures. In Spark, the core set looks like this:
1-- 1. Compact closed partitions; skip the one the stream writes2CALL lake.system.rewrite_data_files(3 table => 'flight_ops.rebooking_events',4 strategy => 'sort',5 sort_order => 'flight_id, event_ts',6 where => "event_date < '2026-11-12'",7 options => map(8 'partial-progress.enabled', 'true',9 'min-input-files', '5'10 )11);12 13-- 2. Fold position deletes so readers merge less at query time14CALL lake.system.rewrite_position_delete_files(15 table => 'flight_ops.bookings_cdc'16);17 18-- 3. Expire snapshots the audit window no longer needs19CALL lake.system.expire_snapshots(20 table => 'flight_ops.rebooking_events',21 older_than => TIMESTAMP '2026-10-13 00:00:00',22 retain_last => 5023);24 25-- 4. Consolidate manifests so planning reads fewer metadata files26CALL lake.system.rewrite_manifests('flight_ops.rebooking_events');27 28-- 5. Remove files no snapshot references, with a safe age threshold29CALL lake.system.remove_orphan_files(30 table => 'flight_ops.rebooking_events',31 older_than => TIMESTAMP '2026-11-09 00:00:00'32);A few things in that block matter more than they look:
- Stay out of the writer's way. Compacting a partition the stream is committing to invites optimistic-concurrency conflicts. Compact closed partitions, with partial progress enabled.
- Snapshot retention is an audit decision. Set the expiry window from how far back you must explain an agent's decision, not from a storage default.
- Orphan cleanup needs a margin. An in-flight commit's files look orphaned until it lands, so keep the age threshold well past your longest write.
- None of this applies to Tableflow tables. Exclude them from every job above.
For compaction on Kafka-written tables specifically, Kafka to Iceberg compaction covers commit intervals, partition design, and conflict handling.
Layout for how agents query: partitioning, sort order, and Z-order
Compaction fixes file count. Layout decides how much data a query can skip, and agents query with unusual consistency: a rebooking agent filters on flight, passenger, route, and time, over and over. Think in three layers:
- Partitioning is the coarse cut: bounded cardinality, filtered by nearly every query, usually a time transform like
days(event_ts). Hidden partitioning lets agents filter onevent_tsand still prune, which generated SQL gets right far more often. - Sort order clusters rows within partitions. Sorting by
flight_id, event_tsputs each flight in few files, so column statistics let engines skip most files for aflight_idfilter. - Z-order interleaves columns filtered in varying combinations, such as origin, destination, and departure date, trading single-column precision for decent pruning on all of them. Keep it to two to four columns.
1-- Declare the layout once; sort compaction honors it2ALTER TABLE lake.flight_ops.rebooking_events3 WRITE ORDERED BY flight_id, event_ts;4 5-- Or cluster on several filter columns together6CALL lake.system.rewrite_data_files(7 table => 'flight_ops.route_history',8 strategy => 'sort',9 sort_order => 'zorder(origin, destination, departure_date)'10);One constraint follows from the ownership table: you can't re-cluster a Tableflow table. If agents hit one with a filter its arrival-order layout doesn't serve, build a derived table you own with the right sort order and maintain that. It is a small extra pipeline and often the biggest latency win in the architecture.
Running the lakehouse half as a managed service
All of this can be done by hand for a handful of tables: metadata queries, scheduled Spark procedures, a spreadsheet of who owns what. It stops working once streams, CDC feeds, and derived tables multiply and agents depend on all of them. That is where LakeOps earns its place. Here is how it handles each problem above, in the order you'd work through them.
See the whole lake first
LakeOps connects to AWS Glue and to any catalog that serves the Iceberg REST API, such as Apache Polaris or Project Nessie, then scans every namespace and table it finds; S3 Tables support is in alpha. Tables on Amazon S3 and S3-compatible storage are supported today, with Google Cloud Storage and Azure in alpha. Tableflow tables published to a catalog LakeOps connects to show up next to the tables your own jobs write.

Table health instead of guesswork
Every table scan checks the table's metadata against fixed thresholds, the same conditions the queries above measure by hand: excessive snapshots and manifests, partitions of mostly small files, partitions with high delete ratios, skewed partitions, and tags or branches with no retention. Each finding is an insight with a severity, and the table's status follows from them: Critical if it has a critical insight, Warning if it has a warning, Healthy otherwise.

Health covers tables you won't maintain too: a Critical Tableflow table isn't yours to fix, but the agents reading it will slow down.
A trail of everything that ran
When a history read gets slow, the first question is what changed. LakeOps records every operation as an event with its table, status, impact, and duration, whether a policy, Adaptive Maintenance, the REST API, or an agent over MCP started it.

Agents get the same trail through the get_table_events MCP tool, which matters for freshness contracts later on.
Insights that say what to fix
Health says a table is unwell. The Insights page says why, lake-wide, ranked by severity from Critical to Info, with the metrics behind each finding and usually the fix to apply.

Maintenance triggered by table state, not a clock
Cron is a poor fit for streaming tables. Write volume follows the business: a storm of cancellations produces a burst of rebooking events, a quiet night almost none. A fixed schedule compacts too often or too late.
LakeOps Adaptive Maintenance watches each table's signals instead: small files, compactable bytes, snapshot and manifest counts, delete files, and how fast they grow per hour. Due operations run in a fixed order: compaction, snapshot expiry, position-delete rewrites, dangling-delete removal, and manifest rewrites. The Maintenance tab shows each one's distance to threshold, a projected trigger time, and a cooldown so it doesn't repeat back to back. Scheduled mode adds a cron cap when maintenance must stay inside a window.

Jobs run on LakeOps-managed compute with a Rust compaction engine built on Apache DataFusion. A job reads only the files it rewrites, writes to your bucket, and commits a new snapshot without blocking concurrent readers or writers, which a table under a live stream needs. It sorts when the table declares a sort order and bin-packs otherwise. See Iceberg table maintenance for the full set of operations.
Proof that maintenance worked
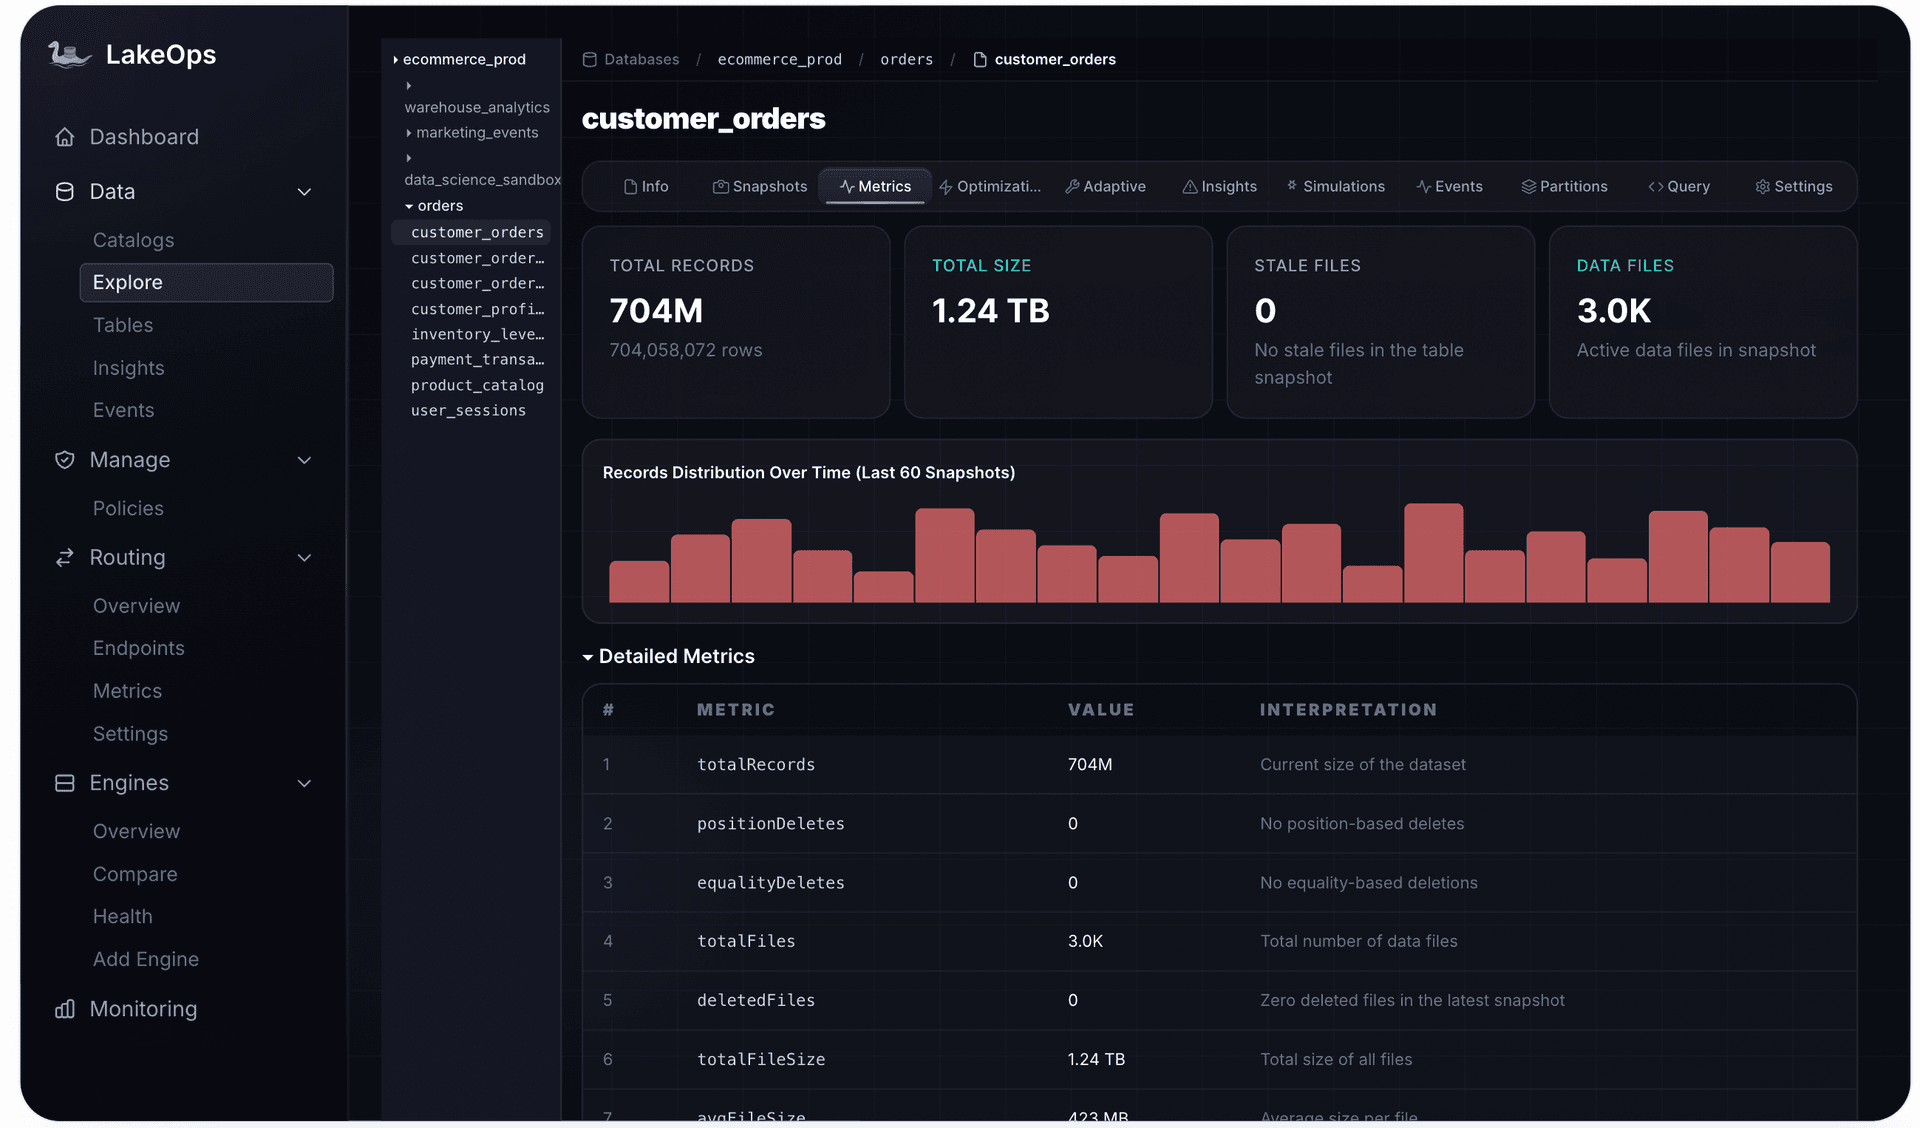
The Metrics tab tracks records, files, delete files, and file sizes over time, so you see what compaction and delete-file rewrites actually did.
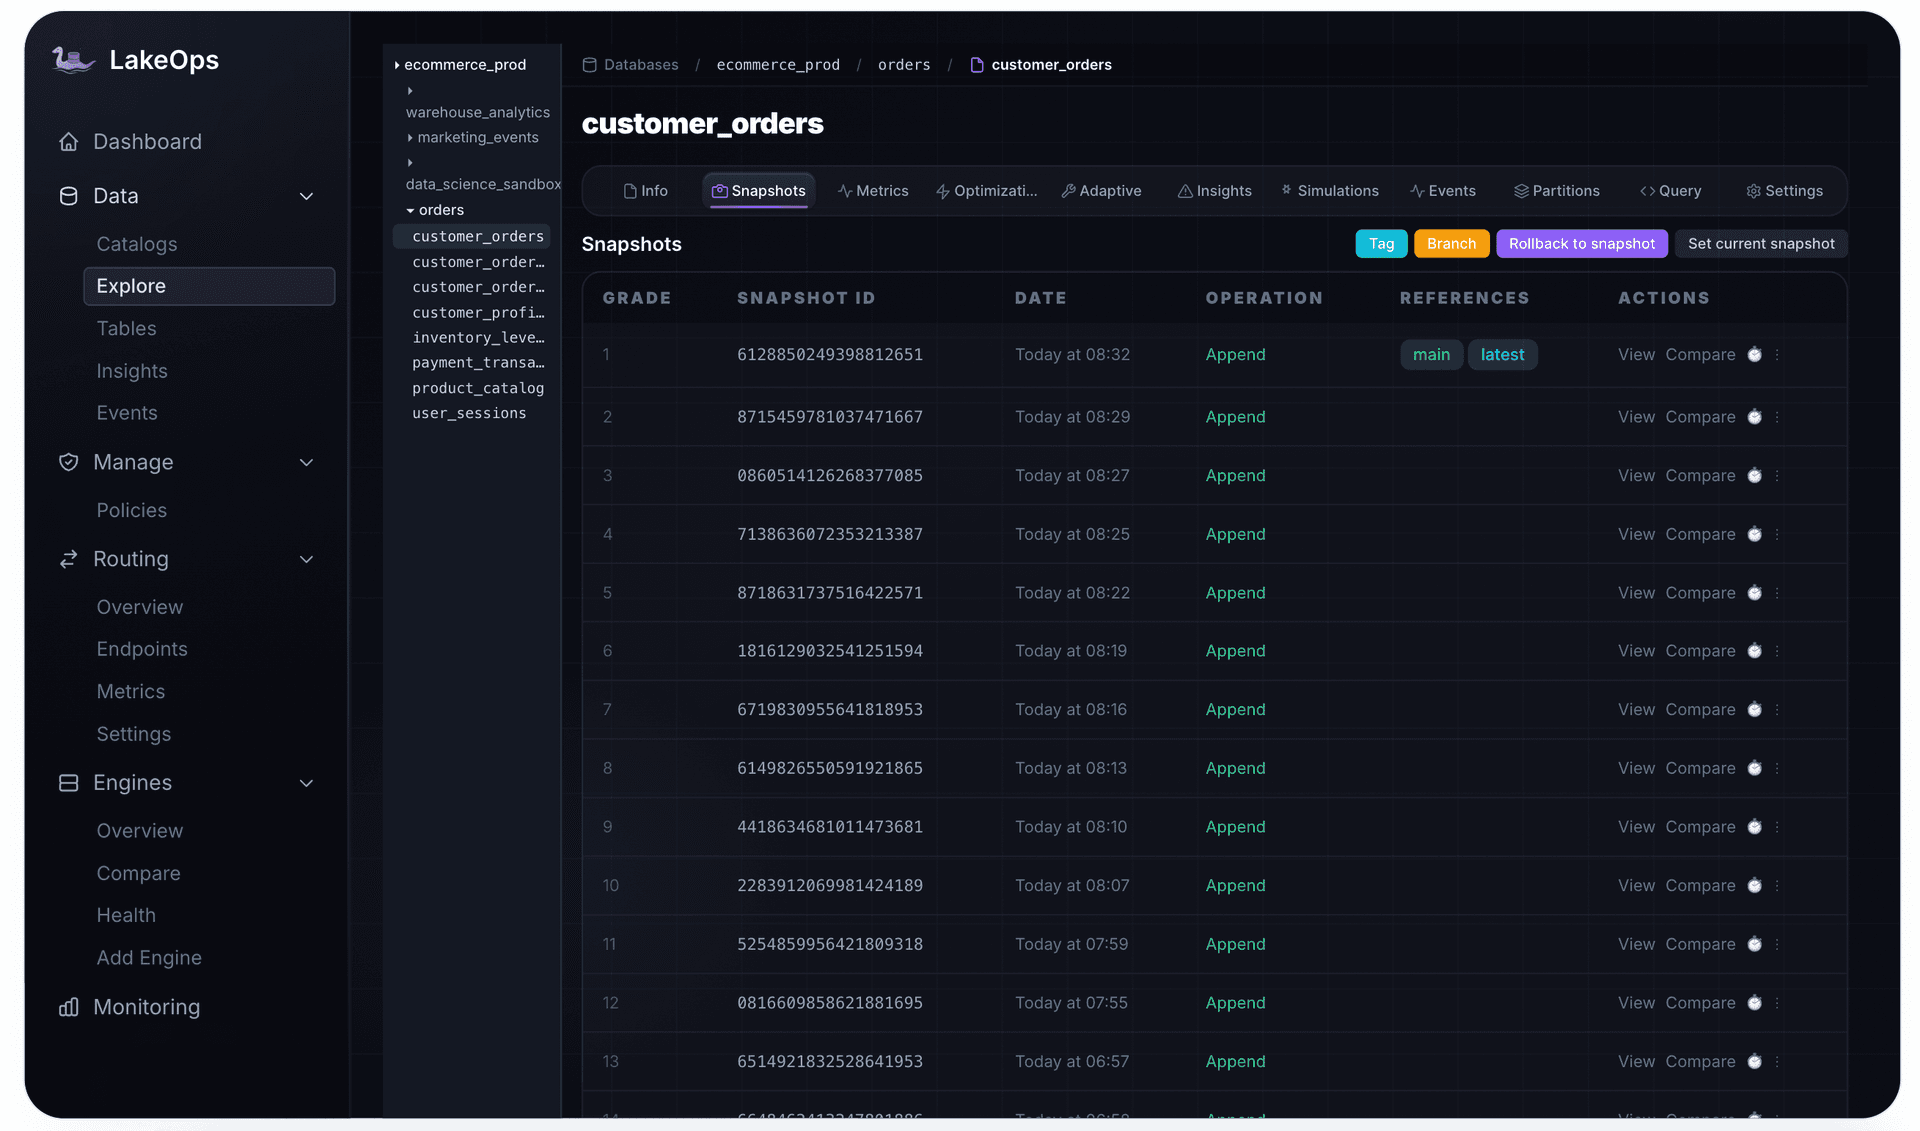
The Snapshots tab shows commit cadence directly, with tag, branch, and rollback actions. Expiry never removes a snapshot a tag still points to, and tags can be created on a schedule with their own retention, so the audit window becomes per-table configuration.
Compare layouts before you change one
Don't trial-and-error a layout change on a table under a live stream. The Simulations tab compares the current layout with generated candidates (partition spec, sort order, target file size) and estimates files scanned, data read, and execution time, without writing to the table. Today the workload is inferred from the schema; workload from real query history is in alpha. Treat the numbers as a ranking, apply the winner with ALTER TABLE ... WRITE ORDERED BY, and let sort compaction rewrite the files.

Policies that respect who owns each table
Here the ownership table becomes configuration. LakeOps policies cover every catalog, one catalog, or specific namespaces and tables by exact name or regex, with exclude lists. A table-level policy wins over any governance policy, then the most specific match, then priority. Disable for this table adds a table to the policy's exclusion list, and new tables that match a scope inherit its policy once LakeOps discovers them.

For a Confluent deployment, the practical setup is:
- Observe Tableflow tables, never maintain them. Put the namespaces Tableflow publishes into an exclude list, or disable maintenance on those tables. They stay visible in health, insights, and events.
- Adaptive Maintenance on everything you own. Sinks, derived tables, CDC tables, and dimensions, with regex scopes so new streaming tables are picked up without anyone remembering to add them.
- Snapshot retention set by audit need. Longer for the tables agents decide from, shorter for raw landing tables, with tags protecting the snapshots that matter.
That is what makes the lakehouse half managed rather than merely monitored. The platform overview shows how sensing, planning, and execution fit together lake-wide.
One endpoint for the history half: QueryFlux
An agent reading the lakehouse through four engines needs four connection strings, four SQL dialects, and four places where nothing stops a full table scan. The fix is one SQL endpoint in front of the engines.
QueryFlux is an open-source SQL proxy written in Rust, maintained by the LakeOps team and licensed under Apache 2.0. It accepts queries over Trino HTTP, PostgreSQL wire, MySQL wire, Snowflake, Arrow Flight SQL, and MCP, and routes each one to a cluster group of Trino, DuckDB, StarRocks, Athena, ClickHouse, or MySQL, or through ADBC to Snowflake, Databricks, BigQuery, and Redshift. It adds well under a millisecond at the median, and the engines and your data stay where they are.
Three features matter most for agents:
- One MCP endpoint. The MCP frontend gives agents tools to run a query, list schemas, describe a table, and read a plan, through the same routing and guardrails as any SQL driver.
- Guardrails in the query path. Guardrails block writes, cap rows, require a
WHEREclause on chosen tables, or call your own Python or webhook check. OPA or Cerbos row filters and column masks apply to agents too. - Every query has an owner. Over MCP, agent context records the agent and conversation, plus step and tool call when the client sends them, so you can replay a session in QueryFlux Studio.
Here is the airline's agent setup in QueryFlux configuration, with cluster definitions left out:
1queryflux:2 frontends:3 mcp:4 enabled: true5 port: 88116 7clusterGroups:8 agents:9 members: [trino-agents]10 maxRunningQueries: 2011 analysts:12 members: [trino-bi]13 maxRunningQueries: 5014 15routers:16 - type: protocolBased17 mcp: agents18 19routingFallback: analysts20 21guardrails:22 global:23 - kind: built_in24 name: read_only25 groups:26 agents:27 - kind: built_in28 name: row_limit29 max_rows: 500030 - kind: built_in31 name: require_predicate32 applies_to:33 - "flight_ops.*"Every MCP query lands in the agents group with its own concurrency cap, so agent bursts queue instead of starving dashboards. Everything is read-only, results are capped, and flight operations tables require a WHERE clause, which blocks the costliest agent mistake: an unfiltered scan of a streaming fact table. In production, also require authentication and per-group allow-lists, as QueryFlux's guide to giving agents SQL, not the keys to every engine shows. Our multi-engine routing guide covers routing rules and engine choice.
A denied query returns the guard's reason to the agent as written, and the agent acts on it. So write reasons as instructions: name the time column to filter on and where to check freshness. QueryFlux's agent session traced call by call shows why, and how successful queries can still return confident wrong answers.
Three caveats before you wire this up:
- Live state stays with Confluent. QueryFlux has no Lightning Tables adapter, so agents use Confluent's MCP tools for live state and QueryFlux for the lakehouse.
- Caches add a clock. A cluster group's result cache serves results until its TTL expires. Keep it short or off for tables that commit every few minutes, and off on agent groups where you need every denial in the audit trail.
- Pin the dialect. QueryFlux translates with sqlglot when the client declares its dialect. That removes most errors, but it can turn an error into a silent wrong answer, so test your agents' idioms on each engine.
Routing inside LakeOps
LakeOps query routing is built on QueryFlux and brings the same endpoint into the control plane, next to table health and maintenance. It is in alpha: the console's routing screens show sample data, and routing itself runs on QueryFlux today.
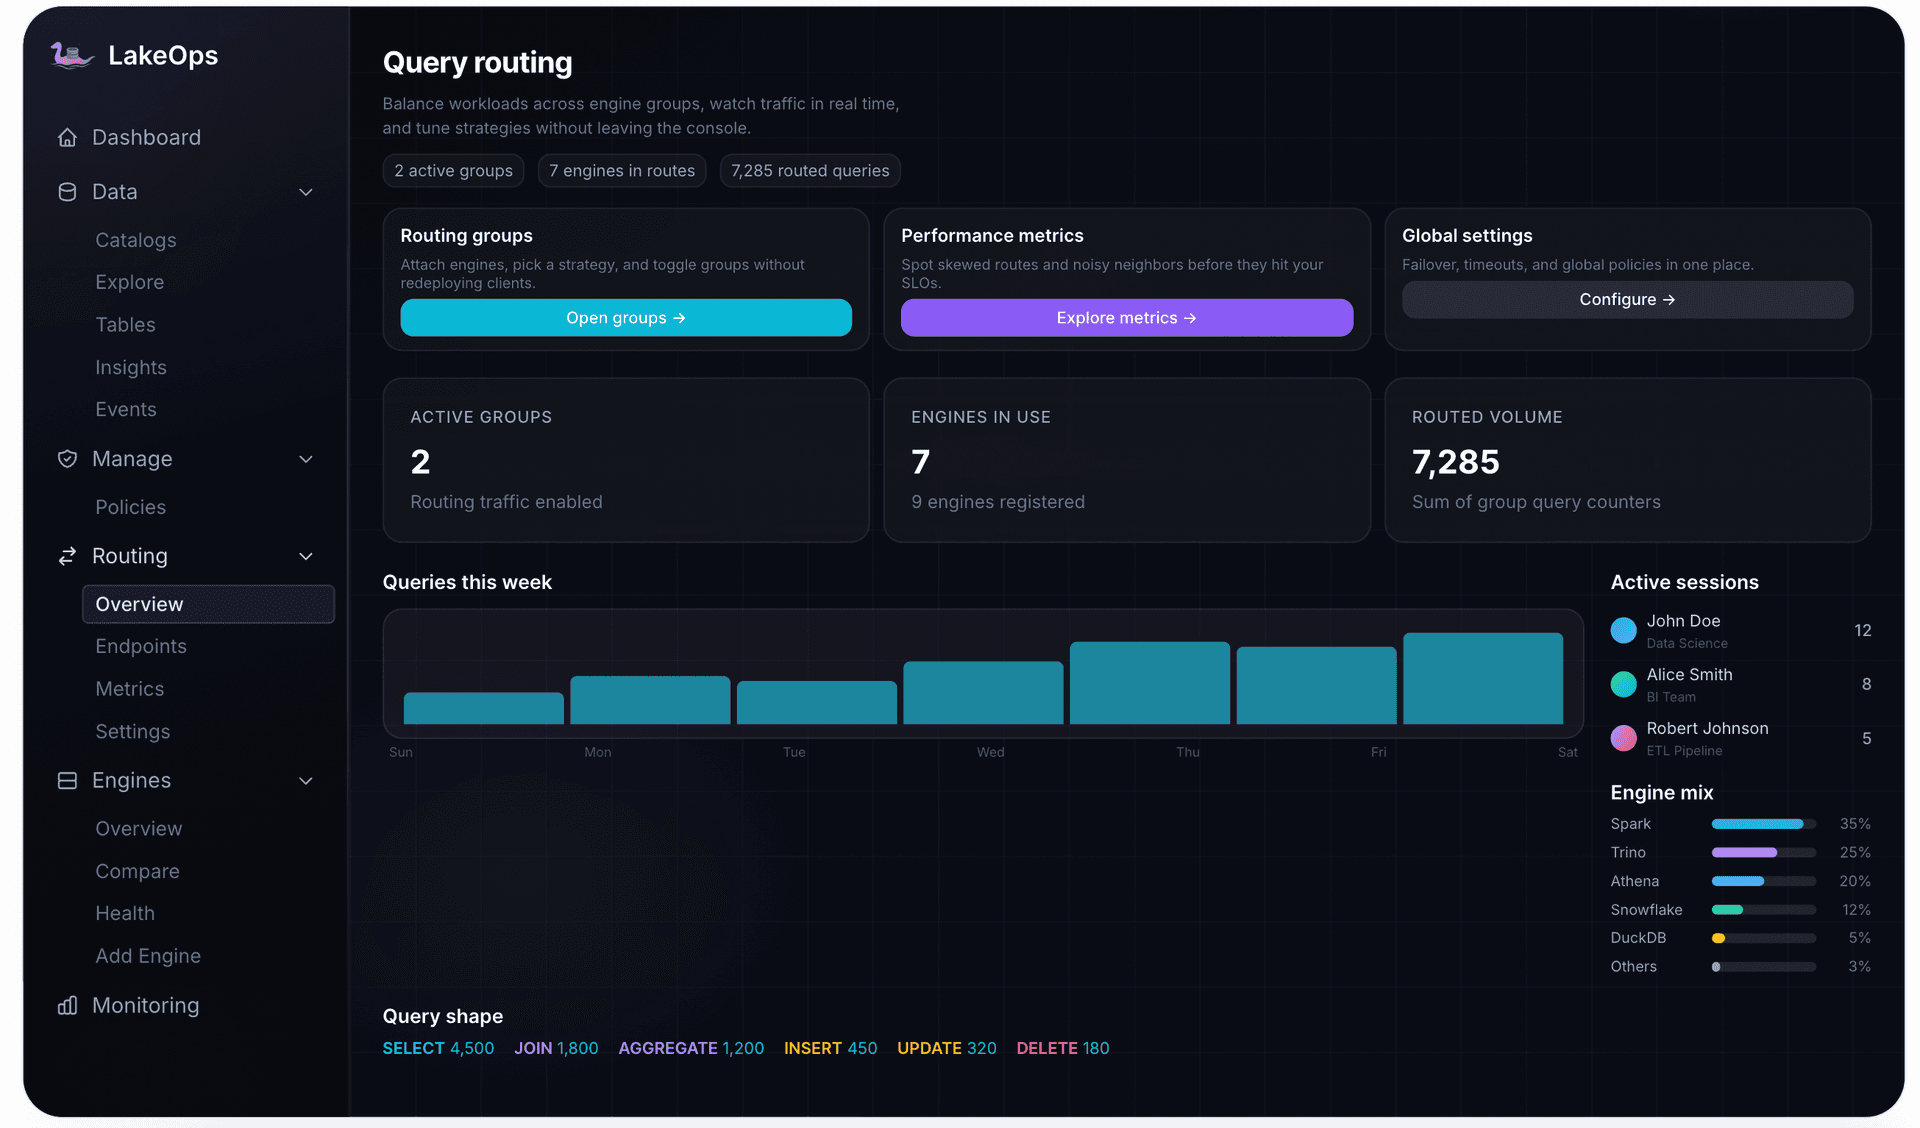
The direction is a closed loop. We're connecting QueryFlux query history to LakeOps so that table layout and maintenance follow what agents actually query. That is the missing input for the query-history workload in Simulations: the columns agents filter and join on would shape layout candidates, and the tables they hit hardest would get maintenance first. Query routing in LakeOps describes where that is heading.
Freshness contracts agents can check
An answer is only useful to an agent if the agent knows what kind of answer it is. Several critiques of the category land on the same gap: a freshness contract, a little metadata that travels with every answer. It needs four fields:
| Field | What it says | Where it comes from on Iceberg |
|---|---|---|
| As-of time | The moment the answer reflects | Latest snapshot committed_at, or the read snapshot ID |
| Completeness | Whether late events could still change it | An event-time watermark column, or the writer's checkpoint |
| Authority | Whether this is the system of record or a derived view | The catalog and namespace, documented per table |
| Health | Whether the table is in a state where the read is trustworthy and fast | Table health, open maintenance signals, recent failed operations |
The first three are one-time design work per table. The fourth changes hourly, so it belongs in a tool the agent calls. In the LakeOps MCP server, get_table_profile returns a table's stats, insights, and maintenance signals in one call, and get_table_events shows what ran and whether it succeeded. The agent checks them before relying on a history read, then answers, caveats, or escalates. See connecting AI agents to Iceberg over MCP for setup.
One rule no tooling replaces: read fast, verify before acting. A Lightning Table or Snapshot Query tells the agent what is probably true. Before anything irreversible, like issuing a ticket or moving money, confirm against the system of record. The Streamhouse makes reads fast, not authoritative.
Reference architecture
Putting it together, a Streamhouse-ready lakehouse on Iceberg looks like this:
1 AI agents and applications2 | |3 live state (Confluent) history (QueryFlux)4 | |5 +-----------v---------+ +---------v-----------+6 | Streamhouse | | QueryFlux |7 | Lightning Tables | | routing, guardrails |8 | Snapshot Queries | | agent context |9 +-----------+---------+ +---------+-----------+10 | |11 Kafka, Flink, Tableflow Trino, Spark, DuckDB12 | |13 +-----------v-----------------------v-----------+14 | Apache Iceberg tables in object storage |15 | Tableflow (vendor-owned) | your tables |16 +-----------------------^-----------------------+17 |18 +-----------------------+-----------------------+19 | LakeOps control plane |20 | health, insights | adaptive maintenance |21 | policies, scopes | layout, events, MCP |22 +-----------------------------------------------+The Streamhouse writes and serves the present. The engines read the past. QueryFlux is the one door agents use for history. The control plane keeps every Iceberg table in a state where that door opens quickly, and tells the agent when it won't.
Checklist: a Streamhouse-ready lakehouse
- Map ownership. Every Iceberg table, its writer, and who maintains it. Vendor-maintained tables are observe-only.
- Measure first. Find which tables are already degrading.
- Maintain by signal, and keep compaction away from partitions a stream is writing.
- Lay tables out for agent queries. Time partitions, sort on agent filter columns, Z-order for combined filters, derived tables where a vendor layout doesn't fit.
- Set retention by audit need, and tag the snapshots that matter.
- One endpoint for history, with read-only, row-limit, and predicate guardrails and agent context on every query.
- Publish freshness contracts the agent can check at read time.
- Verify before irreversible actions.
Two houses, one table format
The Streamhouse is a real step forward for operational AI, and Confluent has shipped a credible version. But every serious agent decision also leans on history, in Iceberg tables that degrade quietly unless something owns them. If you're building on Apache Iceberg as your lakehouse foundation, that is the work that makes a Streamhouse dependable rather than just fast. It is the work LakeOps was built to take off your plate.