
Data pipelines break. Not occasionally — constantly. Schema drift silently corrupts downstream tables. Small files accumulate until queries that used to take 4 seconds take 90. Snapshot metadata bloats past the point where query planning alone exceeds execution time. A partition that handled Black Friday traffic now has 15,000 tiny files while neighboring partitions sit at 20. An upstream producer changes a column type from LONG to STRING and every consumer silently produces wrong results.
The traditional response is reactive: an alert fires at 3 AM, an engineer SSHs into a server, manually diagnoses what went wrong, runs a fix, and hopes it works. The pipeline resumes hours or days later. At 50 tables, this works. At 500 tables across multiple catalogs and engines, it becomes the bottleneck that throttles everything else the data platform team wants to build.
Self-healing data pipelines promise a different model: systems that detect issues before users notice, diagnose root causes automatically, and apply fixes without human intervention. With the convergence of AI agents, Apache Iceberg's metadata-rich table format, and lakehouse control planes like LakeOps, this is moving from theoretical to architecturally achievable.
This guide walks through the principles, patterns, and practical implementation of self-healing pipelines — grounding what's possible today, what requires careful guardrails, and what remains aspirational.
The 3 AM Problem
Before diving into architecture, it is worth understanding the problem viscerally. Here is what happens today when a pipeline breaks at a typical data platform team:
- 1.2:47 AM — A streaming pipeline checkpointing every 60 seconds has accumulated 42,000 small files in
raw_clickstream. Query performance degrades 8×. - 2.3:12 AM — A downstream dashboard times out. PagerDuty fires.
- 3.3:18 AM — An on-call engineer wakes up, opens a laptop, VPNs in.
- 4.3:35 AM — After checking four different monitoring tools across two engines, the engineer identifies small file accumulation as the cause.
- 5.3:50 AM — The engineer writes and runs a Spark compaction job manually.
- 6.4:40 AM — The Spark job finishes. The engineer checks the dashboard. It loads. The engineer goes back to sleep.
- 7.9:00 AM — The engineer writes a post-mortem. The team discusses adding a cron-based compaction job. The ticket sits in the backlog for three sprints.
Multiply this by schema drift events, snapshot bloat, partition skew, and freshness SLA breaches across hundreds of tables. Research from production data platforms shows that data teams spend 30-40% of their engineering capacity on reactive pipeline maintenance — capacity that could be building features, improving data models, or enabling new use cases.
With a control plane providing health signals and agent-accessible tools, the pipeline can fix itself before anyone wakes up.
What "Self-Healing" Actually Means
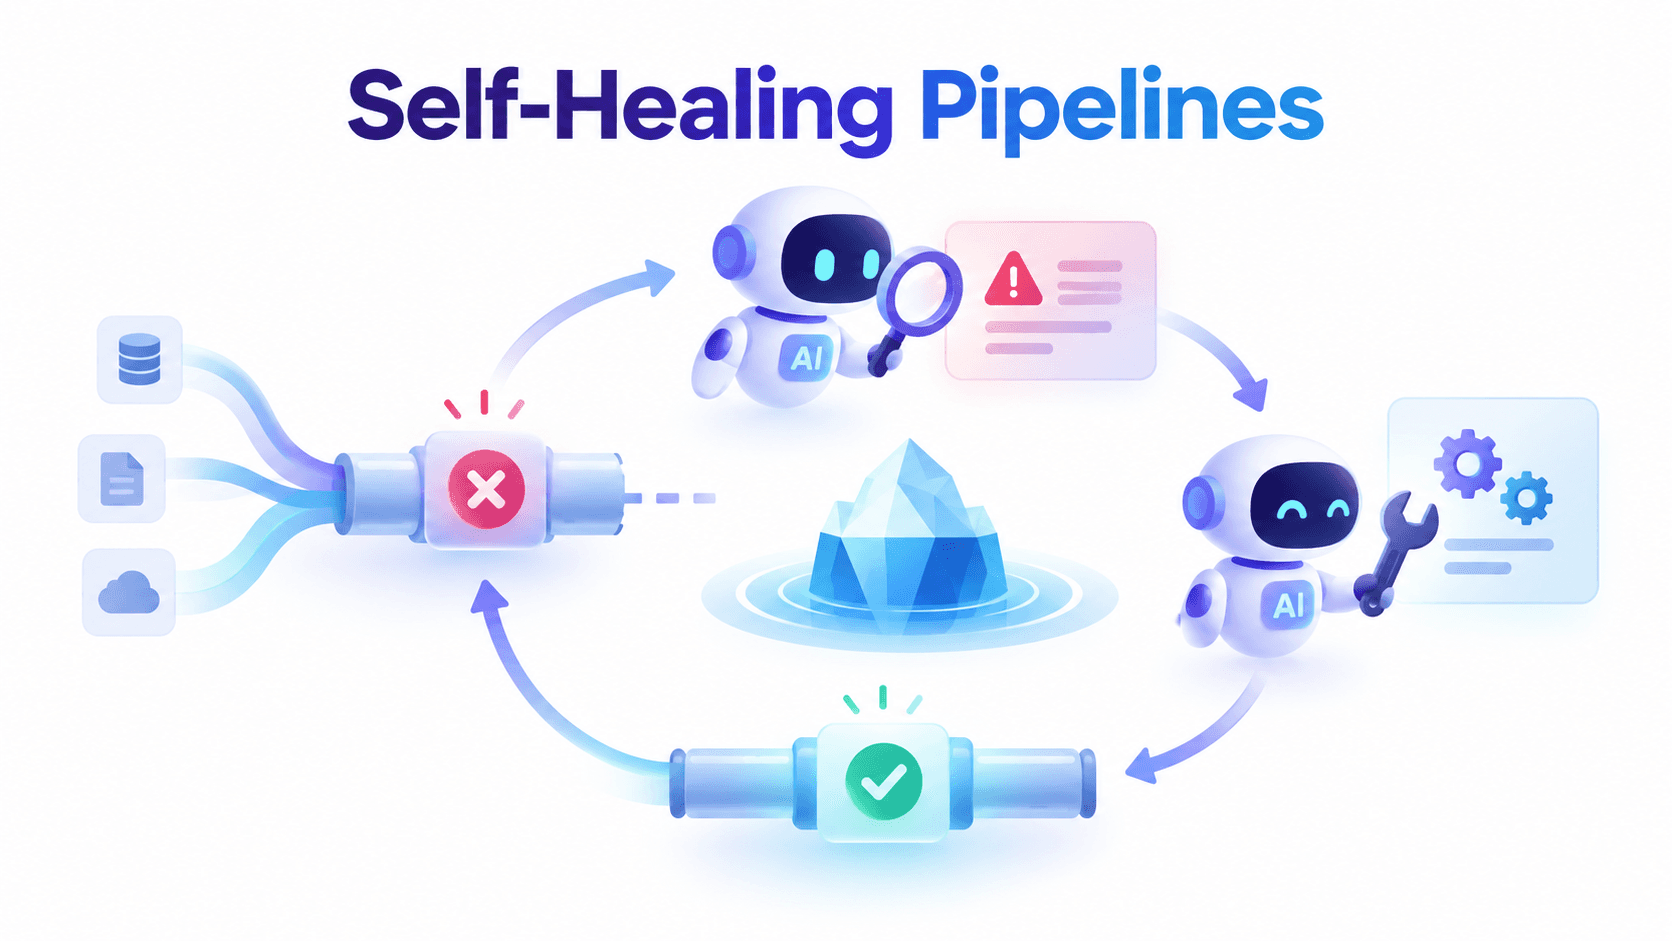
Automated retries with exponential backoff are not self-healing — they are basic error handling. True self-healing operates as a closed-loop control system with four phases:
- 1.Detection — Continuous monitoring of structural health signals, data quality metrics, and query performance. Issues identified in real time, not on polling schedules.
- 1.Diagnosis — AI-powered reasoning about why something broke. Not just "the table is slow" but "312 partitions exceed the file count threshold, causing 8× scan amplification from streaming ingestion checkpointing every 60 seconds."
- 1.Remediation — Autonomous execution of the correct fix, in the correct sequence, with safety guarantees. Roll back to a known good snapshot. Apply schema evolution. Trigger compaction. Route queries to a healthier engine.
- 1.Verification — Post-fix health checks that confirm the remediation resolved the issue and introduced no new degradation. An agent that applies a fix and does not verify the outcome is an agent that can declare success on a failure.
Apache Iceberg provides the primitives that make each phase possible — time travel, snapshots, schema evolution, branching, and rich metadata. AI agents provide the reasoning to connect detection signals to the right remediation action. And a control plane like LakeOps provides the observability infrastructure, MCP connectivity, maintenance engine, and multi-engine routing that ties everything together into a complete self-healing system.
Think of it this way: LakeOps is the control plane that makes self-healing possible. It provides the observability (table health scoring), the AI agent interface (MCP), the remediation tools (compaction, snapshot management, manifest rewrites), and the routing (failover to healthy engines) — all the pieces you need for pipelines that detect, diagnose, and fix their own problems.
Why Iceberg Makes Self-Healing Possible
Self-healing requires more than monitoring and alerting. It requires a data format that supports safe, reversible operations on production data. Apache Iceberg provides four capabilities that make self-healing architecturally feasible in ways that were not possible with Hive tables or earlier lakehouse formats:
Time travel and snapshot rollback. Every write, append, and overwrite creates an immutable snapshot. When a bad write corrupts data, an AI agent can roll back to the last known good snapshot — restoring the table to a consistent state without reprocessing upstream data. This is not a backup restore; it is a metadata pointer change that completes in seconds. In Hive, a bad write meant reprocessing from source. In Iceberg, it means one API call.
Schema evolution with field IDs. Iceberg tracks schema changes through stable field IDs, not column names. Columns can be added, dropped, renamed, or reordered without breaking downstream consumers. When an AI agent detects schema drift between a producer and consumer, it can apply the correct evolution — adding a new column, adjusting a type promotion — through Iceberg's native schema evolution API.
Branching for safe testing. Iceberg branches allow an agent to test a remediation on an isolated copy of the table before applying it to production. A proposed compaction strategy, layout change, or schema fix runs on a branch first. If the results improve health metrics, the branch is promoted. If not, it is discarded — zero risk to production.
Rich metadata for zero-scan diagnostics. Iceberg manifests store per-file, per-column statistics — null counts, value counts, min/max bounds — written at commit time. An AI agent can assess data quality and identify structural degradation without scanning a single data file. This is what makes detection economically viable at scale: an agent can check the health of 500 tables in seconds, entirely from metadata.
These primitives transform self-healing from "detect and alert" to "detect, reason, fix, and verify" — all within the table format itself.
Pillar 1: Detection — Observability That Feeds AI Agents
Self-healing starts with seeing the problem. But traditional monitoring — dashboards, threshold alerts, log aggregation — was designed for humans. AI agents need structured, queryable health signals they can reason about programmatically.
Table Health Scoring
The foundation is continuous health classification of every table in the lake. LakeOps observability scores each table as Healthy, Warning, or Critical based on six structural dimensions:
- File count and size distribution — Small file ratio, average file size, bimodal distribution detection
- Manifest fragmentation — Manifest-to-file ratio, metadata I/O overhead
- Snapshot depth — Accumulation rate vs. retention policy, metadata tree depth
- Delete file accumulation — Position and equality delete ratios for merge-on-read tables
- Partition skew — Per-partition file counts vs. median, hot partition detection
- Sort order drift — Alignment between current sort order and actual query filter patterns
Health state updates with every new commit — not on a polling schedule. A table that transitions from Healthy to Warning at 2:47 AM is visible to an AI agent at 2:47 AM, not at the next scheduled check. This is the detection signal that enables self-healing: not "something might be wrong," but "this specific table has degraded to Critical because 312 partitions exceed the file threshold, causing 8× scan amplification."
Data Quality Signals from Metadata
Beyond structural health, three data quality dimensions are measurable directly from Iceberg metadata — no scanning required:
- Freshness — Time since last commit. If a table's SLA requires data no older than 15 minutes and the last commit was 3 hours ago, the pipeline is broken upstream.
- Completeness — Iceberg manifests store per-file, per-column null counts. A column that was 0.1% null last week and is now 15% null indicates a schema mapping failure or upstream data issue.
- Schema conformance — Schema evolution history is tracked in metadata log entries. Any schema change is visible as an event that an agent can evaluate for downstream impact.
These signals give agents what they need most: structured, machine-readable indicators of table health — not log files to parse or dashboards to screenshot.
MCP: The Agent-Native Interface
AI agents cannot parse dashboards. They need structured tool access. The LakeOps MCP server exposes 27 tools that any MCP-compatible agent — Claude, Cursor, LangChain, or custom — can discover and invoke with zero integration code:
1{2 "mcpServers": {3 "lakeops-us-east-1": {4 "url": "https://api.lakeops.dev/mcp",5 "headers": {6 "Authorization": "Bearer <your-api-key>"7 }8 }9 }10}Key detection tools include:
| Tool | What It Returns |
|---|---|
get_table_health | Health score + maintenance status for any table |
get_table_insights | Severity-ranked findings explaining why a table is Warning or Critical |
get_maintenance_signals | Whether compaction, snapshot expiry, or manifest rewrite is needed, with scores and projected trigger times |
get_hot_partitions | Top partitions by file count with skew detection (flags when hottest partition exceeds 10× average) |
get_lake_health | Org-wide health for the last 30 days across all catalogs |
analyze_critical_triage | Pre-loaded Critical/Warning tables ranked by urgency for on-call triage |
get_table_profile | Combined maintenance profile: stats, insights, signals, and maintenance decisions in one call |
An agent calls get_lake_health to get the big picture, then drills into specific tables with get_table_insights when anomalies appear. Analysis workflows like analyze_table_maintenance provide a full decision workflow — table profile, effective policies, and the last 20 events — producing actionable recommendations, including "do nothing" when signals are within expected bounds.
The entire detection phase runs on metadata — no compute clusters, no data scanning.
Pillar 2: Diagnosis — AI Reasoning About Root Causes
Detection tells you something is wrong. Diagnosis tells you what and why. This is where LLM-powered reasoning transforms structured health signals into actionable understanding — and where AI agents provide capabilities that rule-based automation cannot match.
From Signals to Root Causes
Consider a concrete scenario. An AI agent's monitoring loop detects that raw_clickstream in the analytics namespace has transitioned to Critical status. The agent calls get_table_insights and receives:
1CRITICAL: 312 partitions exceed file threshold2 - Query scan amplified 8×3 - Small file ratio: 87%4 - Average file size: 3.2 MB (target: 256 MB)5 6HIGH: Excessive manifests (487)7 - Planner latency +2.1s per query8 - Manifests accumulated at 2.1/hourA rule-based system would see "small files" and trigger compaction. An LLM-powered agent reasons more deeply:
> "The small file ratio is 87% with an average size of 3.2 MB across 312 partitions. The manifest accumulation rate of 2.1/hour indicates a high-frequency streaming writer — likely a Kafka-to-Iceberg pipeline checkpointing every 60 seconds. Compaction is the correct remediation, but the operation should be sequenced: expire stale snapshots first to dereference files that would otherwise be compacted and then garbage-collected, then compact with a 512 MB target, then rewrite manifests against the clean post-compaction state."
This diagnostic reasoning — connecting the symptom (slow queries) to the mechanism (small file accumulation) to the cause (streaming checkpoint frequency) to the correct remediation sequence — is what distinguishes AI-driven self-healing from automated retries.
Diagnosis Patterns
AI agents encounter a recurring set of failure patterns across production lakehouses. Each requires different diagnostic reasoning and different remediation:
1┌─────────────────────────────────────────────────────────────┐2│ AI AGENT DIAGNOSIS FLOW │3├─────────────────────────────────────────────────────────────┤4│ │5│ Health Signal Root Cause Analysis │6│ ───────────── ─────────────────── │7│ │8│ Small file ratio > 50% ──► Streaming checkpoint interval │9│ too aggressive? Partition │10│ cardinality too high? │11│ │12│ Freshness SLA breach ────► Upstream pipeline failure? │13│ Ingestion backpressure? │14│ Source system outage? │15│ │16│ Null ratio spike ────────► Schema mapping change? │17│ Upstream field dropped? │18│ Type coercion failure? │19│ │20│ Query latency 10× ──────► Sort order drift? Manifest │21│ bloat? Partition skew? │22│ Delete file accumulation? │23│ │24│ Snapshot count 5× policy ► Expiration job failed? │25│ Write velocity increased? │26│ Retention misconfigured? │27│ │28└─────────────────────────────────────────────────────────────┘The key insight: agents classify anomalies against a taxonomy of known failure patterns and only proceed autonomously on failure classes they can handle safely. If an anomaly cannot be matched to a known pattern with sufficient confidence, it is immediately escalated rather than guessed at. This classification step is what separates a reliable self-healing system from a dangerous one.
Pillar 3: Remediation — Autonomous Fixes with Safety Guarantees
Diagnosis without action is just observability with extra steps. The remediation layer is where self-healing pipelines deliver value: automatically applying the correct fix, in the correct sequence, with safety guarantees that prevent the cure from being worse than the disease.
Scenario 1: Data Quality Regression → Snapshot Rollback
Problem: An upstream producer deploys a code change that corrupts a key column. The agent detects a null ratio spike from 0.1% to 47% on customer_id in the orders table.
What the agent does: It identifies the last snapshot where the null ratio was within normal bounds using Iceberg's snapshot history, then rolls back to that snapshot. The table is restored to a consistent state in seconds — no reprocessing, no data recovery from backups.
1-- Agent identifies the last healthy snapshot2SELECT snapshot_id, committed_at3FROM catalog.db.orders.snapshots4WHERE committed_at < TIMESTAMP '2026-09-15 02:30:00'5ORDER BY committed_at DESC6LIMIT 1;7 8-- Agent rolls back to the known good state9CALL catalog.system.rollback_to_snapshot('db.orders', 7284629537213);Verification: After rollback, the agent re-checks the null ratio to confirm it is back to baseline. The corrupted snapshots remain in history for forensic analysis but no longer serve reads.
What makes this safe: Snapshot rollback is a metadata pointer change — reversible, non-destructive, and completes in seconds. This is exactly the kind of operation an agent should handle autonomously.
Scenario 2: Schema Drift → Automated Schema Evolution
Problem: An upstream API changes a field from INTEGER to BIGINT. Downstream Iceberg consumers start failing on type mismatch.
What the agent does: It detects the schema change via metadata log entries, evaluates whether the type promotion is safe (INTEGER → BIGINT is a widening promotion, always safe in Iceberg), and applies the evolution:
1-- Agent applies safe type promotion2ALTER TABLE catalog.db.events3 ALTER COLUMN event_count TYPE BIGINT;For unsafe changes — like STRING to INTEGER — the agent flags the issue for human review instead of applying it automatically. This is where guardrails matter: the agent has a policy-defined boundary between autonomous action and human escalation.
What makes this practical today: Iceberg's schema evolution is additive and non-destructive for safe type promotions. The agent is not rewriting data; it is updating metadata to accept a wider type. The risk profile is low enough for autonomous action.
Scenario 3: Small File Accumulation → Intelligent Compaction
Problem: A streaming pipeline writing to raw_clickstream has accumulated 42,633 small files averaging 3.2 MB each. Query performance has degraded 8×.
What happens: LakeOps intelligent compaction handles this autonomously. The system detects the degradation through continuous health monitoring, sequences the operations correctly, and executes on a purpose-built Rust and DataFusion engine — 95% faster and 90% cheaper than Spark-based compaction:
1┌────────────────────────────────────────────────────┐2│ COORDINATED MAINTENANCE SEQUENCE │3├────────────────────────────────────────────────────┤4│ │5│ Step 1: Expire Snapshots │6│ ├─ Remove snapshots past retention window │7│ └─ Dereference files for garbage collection │8│ │ │9│ ▼ │10│ Step 2: Orphan File Cleanup │11│ ├─ Remove unreferenced files from storage │12│ └─ Reclaim storage (74.8 GB in example) │13│ │ │14│ ▼ │15│ Step 3: Query-Aware Compaction │16│ ├─ Merge 42,633 files → 69 optimally-sized files │17│ ├─ Sort by columns agents actually filter on │18│ └─ 512 MB target file size │19│ │ │20│ ▼ │21│ Step 4: Manifest Rewrite │22│ ├─ Consolidate fragmented manifests │23│ └─ Refresh Puffin column statistics │24│ │25│ Result: 12× faster queries, 76% less CPU │26└────────────────────────────────────────────────────┘The compaction is query-aware — it analyzes which columns queries actually filter on (from agent and engine telemetry), then physically re-sorts data to match, enabling engines to skip entire file groups via min/max pruning. For a deeper dive, see the small files guide.
Why sequencing matters: Expiring snapshots before compacting prevents the system from merging files that are about to be garbage-collected anyway. Rewriting manifests after compaction produces clean manifests that reference the new, optimally-sized files. Getting this order wrong wastes compute and can leave metadata in a worse state.
Scenario 4: Query Performance Degradation → Engine Routing
Problem: Agent queries are timing out because they hit a Spark cluster sized for batch ETL, not interactive lookups.
What happens: LakeOps multi-engine routing directs each query to the optimal engine through a single SQL endpoint. When one engine is overloaded or a table's health degrades, routing automatically shifts traffic:
| Metric | Spark | Trino | DuckDB | Snowflake |
|---|---|---|---|---|
| Avg runtime | 3.1s | 1.8s | 0.5s | 2.1s |
| Cost per query | $0.04 | $0.03 | $0.01 | $0.08 |
| Success rate | 99.2% | 99.5% | 99.9% | 99.8% |
Agents connect via standard Postgres, MySQL, or Arrow Flight protocols — no custom SDK required. Routing groups let platform teams assign dedicated engine pools for agent traffic, keeping interactive AI queries from sitting behind batch ETL jobs. As table health improves after compaction, routing weights update automatically — agents land on faster engines.
Scenario 5: Pipeline Failure → Agent-Driven Recovery
Problem: A nightly ETL job fails because a source table's partition key changed from daily to hourly granularity.
What the agent does:
- 1.Detects the freshness SLA breach via
get_table_health - 2.Inspects the pipeline error logs and identifies the partition mismatch
- 3.Checks the source table's current partition spec via
get_schema - 4.Modifies the pipeline's partition filter to match the new granularity
- 5.Retries the failed job on the corrected logic
- 6.Verifies the output table's freshness returns to SLA compliance
This diagnose → modify → retry → verify loop is the core pattern of agent-driven pipeline recovery. Research in 2026 shows multi-agent systems achieving 73% MTTR reduction and 94.6% autonomous resolution of common pipeline failures using this approach.
Pillar 4: Verification — Closing the Loop
A self-healing system that applies fixes without confirming they worked is not self-healing — it is automated gambling. The verification step is what closes the control loop and distinguishes reliable systems from dangerous ones.
After every remediation action, the agent re-checks the signals that triggered the original detection:
1def verify_remediation(table, original_insights, action_taken):2 """Re-check health after remediation. Escalate if unresolved."""3 4 time.sleep(60) # Wait for operation to complete5 6 post_health = lakeops.call("get_table_insights", {7 "catalog": table["catalog"],8 "namespace": table["namespace"],9 "table": table["name"]10 })11 12 if post_health["status"] == "HEALTHY":13 log_success(table, action_taken, original_insights, post_health)14 return True15 16 if post_health["status"] == original_insights["status"]:17 # Remediation did not help — escalate, do not retry blindly18 escalate_to_human(19 table=table,20 action_taken=action_taken,21 before=original_insights,22 after=post_health,23 message="Automated remediation did not resolve the issue"24 )25 return False26 27 # Partial improvement — log and continue monitoring28 log_partial_improvement(table, action_taken, original_insights, post_health)29 return TrueThree verification principles:
- 1.Never retry blindly. If a remediation does not resolve the issue, escalate to a human. Repeated automated fixes on a misdiagnosed problem make things worse.
- 2.Check for new degradation. A compaction that fixes small files but introduces partition skew is not a success.
- 3.Log everything. The verification result, combined with the diagnosis and remediation, creates an audit trail that the agent (and humans) can learn from.
The Self-Healing Architecture
The complete self-healing architecture connects all four pillars into a continuous loop:
1┌──────────────────────────────────────────────────────────────────┐2│ SELF-HEALING CONTROL LOOP │3│ │4│ ┌───────────┐ ┌───────────┐ ┌──────────────┐ │5│ │ │ │ │ │ │ │6│ │ DETECT │───►│ DIAGNOSE │───►│ REMEDIATE │ │7│ │ │ │ │ │ │ │8│ └───────────┘ └───────────┘ └──────┬───────┘ │9│ ▲ │ │10│ │ ┌───────────┐ │ │11│ │ │ │ │ │12│ └───────────│ VERIFY │◄───────────┘ │13│ │ │ │14│ └───────────┘ │15│ │16│ ───────────────────────────────────────────────────────────── │17│ │18│ DETECT │ LakeOps observability + MCP tools │19│ ─────────────── │ Health scores, freshness, null ratios, │20│ │ partition skew, manifest fragmentation │21│ │22│ DIAGNOSE │ LLM reasoning over structured signals │23│ ─────────────── │ Root cause analysis, impact assessment, │24│ │ remediation planning │25│ │26│ REMEDIATE │ Iceberg primitives + LakeOps automation │27│ ─────────────── │ Rollback, schema evolution, compaction, │28│ │ engine rerouting, policy execution │29│ │30│ VERIFY │ Post-fix health check │31│ ─────────────── │ Confirm fix resolved the issue, │32│ │ no new degradation introduced │33│ │34└──────────────────────────────────────────────────────────────────┘The Monitoring Agent Loop
In practice, a self-healing agent runs a continuous monitoring loop. Here is the full pattern using LakeOps MCP tools:
1import time2import logging3from mcp_client import MCPClient4 5logger = logging.getLogger("self_healing_agent")6lakeops = MCPClient("https://api.lakeops.dev/mcp", api_key="...")7 8SAFE_AUTONOMOUS_ACTIONS = {9 "compaction", "expire_snapshots", "rewrite_manifests",10 "snapshot_rollback", "safe_schema_evolution"11}12 13def self_healing_loop(interval_seconds=300):14 """Main control loop: detect → diagnose → remediate → verify."""15 16 while True:17 # ── DETECT ──────────────────────────────────────────18 lake_health = lakeops.call("get_lake_health")19 20 critical_tables = [21 t for t in lake_health["tables"]22 if t["status"] in ("CRITICAL", "WARNING")23 ]24 25 logger.info(f"Scan complete: {len(critical_tables)} tables need attention")26 27 for table in critical_tables:28 try:29 handle_degraded_table(table)30 except Exception as e:31 logger.error(f"Error handling {table['name']}: {e}")32 escalate_to_human(table, error=str(e))33 34 time.sleep(interval_seconds)35 36 37def handle_degraded_table(table):38 """Full detect → diagnose → remediate → verify for one table."""39 40 # ── DIAGNOSE ────────────────────────────────────────41 insights = lakeops.call("get_table_insights", {42 "catalog": table["catalog"],43 "namespace": table["namespace"],44 "table": table["name"]45 })46 47 signals = lakeops.call("get_maintenance_signals", {48 "catalog": table["catalog"],49 "namespace": table["namespace"],50 "table": table["name"]51 })52 53 # Classify the failure and determine remediation54 action = classify_and_plan(insights, signals)55 56 if action["type"] not in SAFE_AUTONOMOUS_ACTIONS:57 escalate_to_human(table, insights, action)58 return59 60 # ── REMEDIATE ───────────────────────────────────────61 logger.info(f"Applying {action['type']} to {table['name']}")62 63 if signals.get("needs_compaction"):64 lakeops.call("execute_policy", {65 "policy_id": find_compaction_policy(table)66 })67 68 if signals.get("needs_expire_snapshots"):69 lakeops.call("execute_policy", {70 "policy_id": find_expiration_policy(table)71 })72 73 if signals.get("needs_rewrite_manifests"):74 lakeops.call("execute_policy", {75 "policy_id": find_manifest_policy(table)76 })77 78 # ── VERIFY ──────────────────────────────────────────79 time.sleep(60) # Wait for operation to complete80 81 post_health = lakeops.call("get_table_insights", {82 "catalog": table["catalog"],83 "namespace": table["namespace"],84 "table": table["name"]85 })86 87 if post_health["status"] == "HEALTHY":88 logger.info(f"✓ {table['name']} restored to HEALTHY")89 else:90 logger.warning(f"✗ {table['name']} still {post_health['status']}")91 escalate_to_human(table, insights, post_health)The critical design choices in this loop:
- 1.The agent classifies before acting. Unknown failure patterns are escalated, not guessed at.
- 2.Safe actions are whitelisted. Compaction, snapshot expiry, and manifest rewrites are non-destructive. Dropping columns or modifying partition strategies require human approval.
- 3.Every action is verified. The agent checks post-remediation health and escalates if the fix did not work.
- 4.The agent handles the 90%. Humans handle the 10% that requires judgment — novel failures, cross-system issues, business logic changes.
LakeOps as the Self-Healing Control Plane
The architecture described above requires three infrastructure components working together. Building them from scratch is possible but represents months of engineering. LakeOps provides all three as a unified control plane for Apache Iceberg lakehouses:
Observability for detection — LakeOps observability continuously classifies every table as Critical, Warning, or Healthy based on file layout, manifest health, snapshot depth, and query patterns. Table-level insights surface problems at four severity levels (Critical, High, Warning, Low) with specific metrics, thresholds, and recommended actions. Cross-engine telemetry from Trino, Spark, Snowflake, Athena, DuckDB, and Flink provides a unified view — no more correlating metrics across siloed engine UIs.
AI agent connectivity for diagnosis — The LakeOps MCP server exposes 27 tools for agent consumption across discovery, analysis, and governance categories. AI agents connect via standard MCP with layered guardrails — ReadOnly blocks DDL, CostEstimate rejects expensive scans, PIIMask hashes sensitive columns before results reach the model, and HumanApproval pauses high-stakes operations. Agent query patterns feed back into compaction sort-order decisions — a closed loop where the lake optimizes for how agents actually use it.
Automation engine for remediation — LakeOps autonomous maintenance runs the full sequenced pipeline triggered by health signals, not fixed schedules. The compaction engine, built on Rust and DataFusion, operates at $5/TB versus Spark's $50/TB. The sense → plan → optimize → learn cycle means the system improves continuously: sort orders adapt as query patterns change, compaction cadence adjusts to write velocity, and idle tables are skipped while streaming tables are maintained hourly. Declarative policies define maintenance behavior at any scope — set once, enforced continuously across all catalogs, whether you run AWS Glue, Polaris, Nessie, or Gravitino.
For a deeper exploration of how AI agents interact with Iceberg lakehouses, see Iceberg Lakehouse with AI Agents: A Guide. For the mechanics of autonomous table maintenance, see Autonomous Iceberg Table Maintenance. And for the data quality and health scoring framework, see Iceberg Data Quality and Table Health.
Guardrails: What Self-Healing Agents Should Not Do
Self-healing does not mean unrestricted autonomous action. The most important design principle is bounded autonomy — agents have clear boundaries between what they can do automatically and what requires human approval.
| Safe for Autonomous Action | Requires Human Approval |
|---|---|
| Snapshot rollback (reversible, metadata-only) | Dropping columns or tables (irreversible) |
| Compaction on degraded tables (non-destructive) | Narrowing type changes (potential data loss) |
| Snapshot expiry past retention (policy-defined) | Modifying partition strategies (broad impact) |
| Safe schema evolution (widening promotions) | Overriding retention policies (compliance) |
| Manifest rewrites (metadata consolidation) | DDL against production catalogs |
| Query routing to a different engine | Changes affecting compliance-sensitive data |
LakeOps enforces these boundaries through stackable guardrails per routing group and scoped API key permissions. A HumanApprovalGuard pauses high-stakes operations and waits for explicit approval. API keys carry domain-specific scopes — a key with policies:read and tables:read cannot execute maintenance, while policies:write enables policy execution without granting tables:delete. The agent's autonomy is defined by the endpoint it connects to, not by the agent's own judgment.
Additional practical guardrails for production deployments:
- Cost caps: Set a maximum per-investigation and per-fix budget (e.g., $0.75 per diagnosis, $0.25 per fix, $50 hard cap per cycle) to prevent runaway API costs from cascading failures.
- Circuit breakers: If a bad deploy breaks 100 tables simultaneously, the agent should batch and prioritize, not attempt 100 independent fix cycles.
- Audit trails: Every agent action — diagnosis, remediation, verification — is logged with the query that triggered it. LakeOps logs every maintenance operation with duration, impact, and status for compliance reporting.
What's Possible Today vs. What's Coming
Honesty about the current state of self-healing pipelines matters. Here is where things stand:
Achievable today:
- Autonomous compaction, snapshot expiry, orphan cleanup, and manifest rewrites triggered by health signals (LakeOps does this in production now)
- AI agent monitoring loops that detect degradation and generate tickets or alerts
- Snapshot rollback for data quality regressions (metadata-only, reversible)
- Safe schema evolution for widening type promotions
- Engine routing based on table health and query characteristics
- Human-in-the-loop approval for high-risk remediations
Requires careful implementation:
- Fully autonomous diagnosis-to-remediation loops for known failure patterns (the agent code patterns shown above work, but require thorough testing and guardrails per environment)
- Cross-pipeline root cause analysis (tracing a freshness breach back through multiple upstream dependencies)
- Agent-driven schema drift resolution across multiple consumers
Still aspirational:
- Agents that autonomously fix arbitrary business logic failures
- Full self-healing across multi-cloud, multi-catalog environments without per-environment tuning
- Agents that adapt to entirely novel failure patterns without human-defined playbooks
The practical path is to start with what works — autonomous maintenance and monitoring — and progressively expand the boundary of agent autonomy as trust is established through verified outcomes.
From Reactive to Autonomous: A Practical Migration Path
Building self-healing pipelines is not a big-bang project. It is a graduated migration from reactive to autonomous:
Stage 1: Visibility (Week 1). Connect your catalogs to LakeOps. Get health scores on every table. Understand the baseline state of your lake — how many tables are Critical, where small files are accumulating, which partitions are skewed.
Stage 2: Automated maintenance (Weeks 2–4). Enable autonomous compaction, snapshot expiration, and orphan cleanup. Start with the most degraded tables. Measure impact on query performance and cost. This alone addresses the most common self-healing scenario — structural degradation from normal write patterns.
Stage 3: AI agent monitoring (Month 2). Connect an AI agent to the LakeOps MCP server with read-only access. The agent checks health, generates reports, triages Critical tables, and creates tickets. This is AI-powered observability without autonomous remediation — building trust in agent judgment.
Stage 4: Bounded self-healing (Month 3+). Grant the agent policies:write scope for safe operations. Keep destructive operations behind human approval. Monitor decision quality through the audit trail. The agent starts handling the routine fixes — compaction, snapshot expiry, manifest rewrites — while escalating novel issues.
Stage 5: Full closed-loop (Ongoing). Monitoring, diagnosis, and remediation runs continuously. Health scores stay green. The data platform team shifts from firefighting to building. The 3 AM page becomes a Slack notification that the agent already handled it.
The Compound Effect
As storage optimizes for actual query patterns, more engines become viable for each query shape. A query that required Trino on an uncompacted table might run on DuckDB after compaction — 4× faster and 8× cheaper. Better routing generates more performance data, which further improves compaction decisions. The lake gets faster the more agents use it.
Production benchmarks from LakeOps deployments:
- 12× faster queries after compaction and layout optimization
- 76% less compute across all engines
- 56% storage reclaimed from orphans, snapshots, and bloat
- 100% table health maintained autonomously across 786+ tables
The data pipeline that never breaks does not exist. The data pipeline that detects its own problems, diagnoses root causes, fixes itself, and verifies the fix — that is the pipeline worth building. The ingredients are available today: Iceberg provides the safe, reversible primitives. AI agents provide the reasoning. And a control plane like LakeOps provides the observability, the tools, and the automation engine that connects them into a self-healing system.
LakeOps is an intelligent control plane for Apache Iceberg lakehouses. Connect your catalogs in 10 minutes and get autonomous optimization for query speed, cost, and table health — across every table and engine. No vendor lock-in, no code changes, no data movement.