

Your dashboards are lagging. Analysts are complaining. Queries that used to finish in seconds now take minutes. You have not added significantly more data, your compute cluster looks healthy, and nothing in the application layer changed. The problem is not your query engine — it is the physical structure of your Iceberg tables.
Slow Iceberg queries almost always trace back to five structural problems hiding in your table's metadata and file layout: small files, wrong sort order, manifest bloat, stale snapshots, and partition misalignment. Left unchecked, they compound — small files breed manifest bloat, stale snapshots pin dead data, and misaligned partitions defeat file skipping. A table suffering from two or three of these issues simultaneously can be 10–50x slower than the same data stored correctly. For a comprehensive Iceberg performance optimization walkthrough covering all five degradation surfaces and how to address them together, see the pillar guide.
This guide walks through each root cause with diagnostic SQL for Spark and Trino, then presents two fix strategies. Path 1 uses LakeOps — an autonomous Iceberg optimization platform that detects and resolves these problems continuously by analyzing query patterns, compacting files, rewriting manifests, and adapting sort orders without manual intervention. Path 2 covers the manual approach: SQL procedures, table properties, and scheduled maintenance you build yourself.

How Iceberg query planning works (and where it breaks)
Before diagnosing specific problems, it helps to understand the performance-critical path. When a query engine — Spark, Trino, Flink, or any Iceberg-compatible engine — receives a query against an Iceberg table, it does not immediately scan data files. Instead, it walks a metadata tree.
First, the engine reads the current metadata.json to locate the active snapshot. From the snapshot, it reads the manifest list — an index of all manifest files in the table. Each manifest list entry contains partition value ranges, allowing the planner to skip entire manifests whose partitions cannot match the query predicate. This is Level 1 pruning.
For the surviving manifests, the engine reads per-file metadata: file path, partition values, column-level min/max statistics, null counts, and row counts. It evaluates query predicates against these statistics to skip files that cannot contain matching rows. This is Level 2 pruning — and it is where sort order determines everything.
The planning phase finishes when the engine has a list of data files to scan. Only then does it issue GET requests to object storage to read actual data. Every structural problem in this guide degrades either the planning phase (too many manifests, too many files to evaluate) or the pruning efficiency (wrong sort order, overlapping min/max ranges, too-broad partitions).

Root cause 1: Small file explosion
Symptoms: Query planning takes 5–30 seconds before any data is scanned. High S3 GET request counts. Cloud storage bills climbing without proportional data growth.
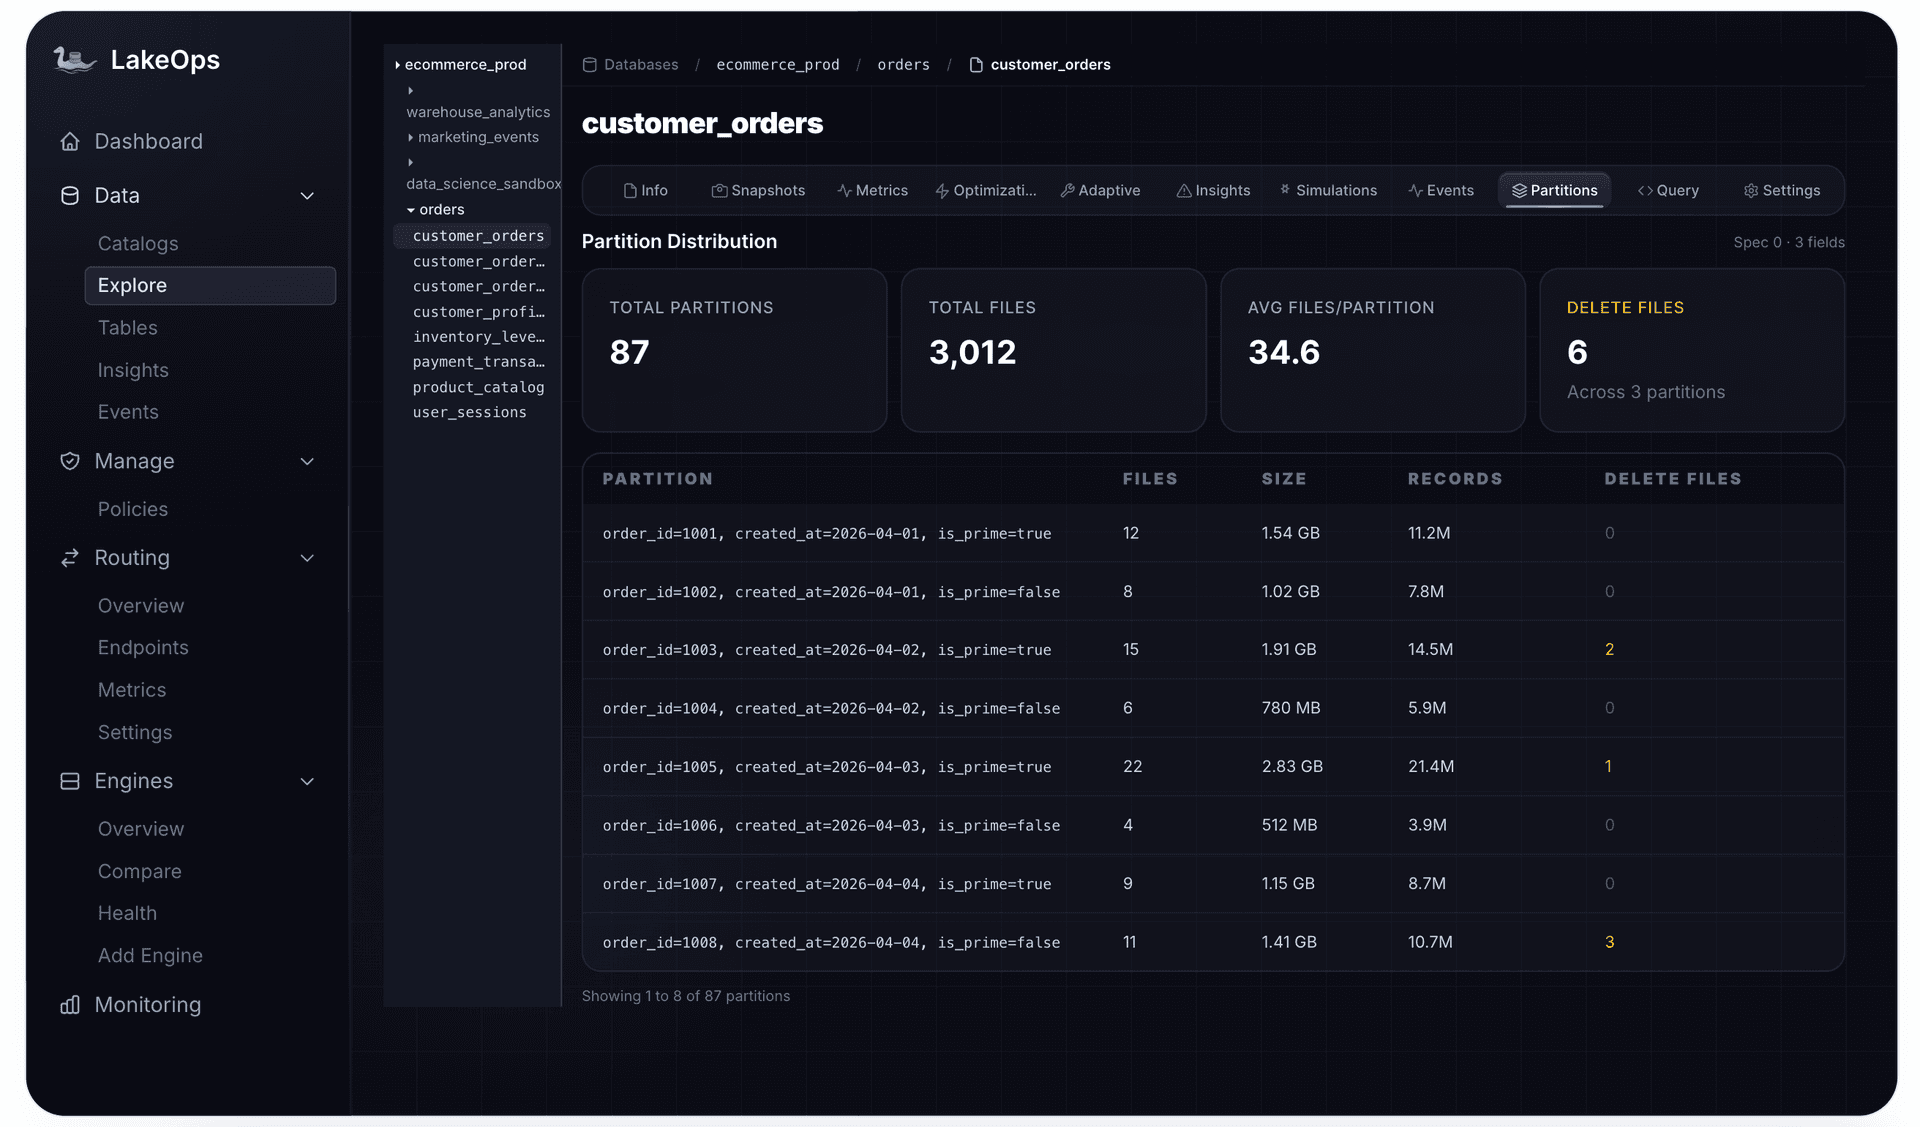
Why it happens: Streaming jobs with short checkpoint intervals, high-cardinality partitioning, frequent MERGE INTO operations, and concurrent writers all produce undersized files. A Flink job checkpointing every 60 seconds across 50 partitions creates 72,000 files per day — most under 5 MB. The query planner must evaluate every one of them, regardless of how selective the query is.
Why it causes slowness: Each data file gets a manifest entry. More files mean more manifest entries, more manifests, and more S3 GETs during planning. A table with 200,000 small files can take 15–30 seconds just to plan, compared to under a second with 2,000 properly sized files. The small files problem also defeats column statistics — more files with fewer rows produce wider, overlapping min/max ranges that reduce pruning effectiveness.
Diagnose it
1-- Spark: file size distribution2SELECT3 COUNT(*) AS total_files,4 ROUND(AVG(file_size_in_bytes) / 1048576, 1) AS avg_file_mb,5 ROUND(PERCENTILE(file_size_in_bytes, 0.5) / 1048576, 1) AS median_file_mb,6 ROUND(MIN(file_size_in_bytes) / 1048576, 1) AS min_file_mb,7 SUM(CASE WHEN file_size_in_bytes < 33554432 THEN 1 ELSE 0 END) AS files_under_32mb8FROM catalog.db.my_table.files;1-- Trino: file size distribution2SELECT3 COUNT(*) AS total_files,4 ROUND(AVG(file_size_in_bytes) / 1048576.0, 1) AS avg_file_mb,5 ROUND(MIN(file_size_in_bytes) / 1048576.0, 1) AS min_file_mb,6 COUNT_IF(file_size_in_bytes < 33554432) AS files_under_32mb7FROM "catalog"."db"."my_table$files";If avg_file_mb is below 64 or files_under_32mb is more than 30% of total files, you have a small file problem.
Root cause 2: Wrong or missing sort order
Symptoms: Queries with selective WHERE clauses still scan most of the table. High data scan volumes relative to result set size. File skipping metrics show low pruning rates.
Why it happens: Tables are created without a sort order, or with a sort order that does not match how the table is actually queried. A table sorted by created_date is useless for queries filtering on customer_id. Without effective sort order, every file's min/max range for the filtered column spans the entire value domain — no files can be pruned at Level 2.
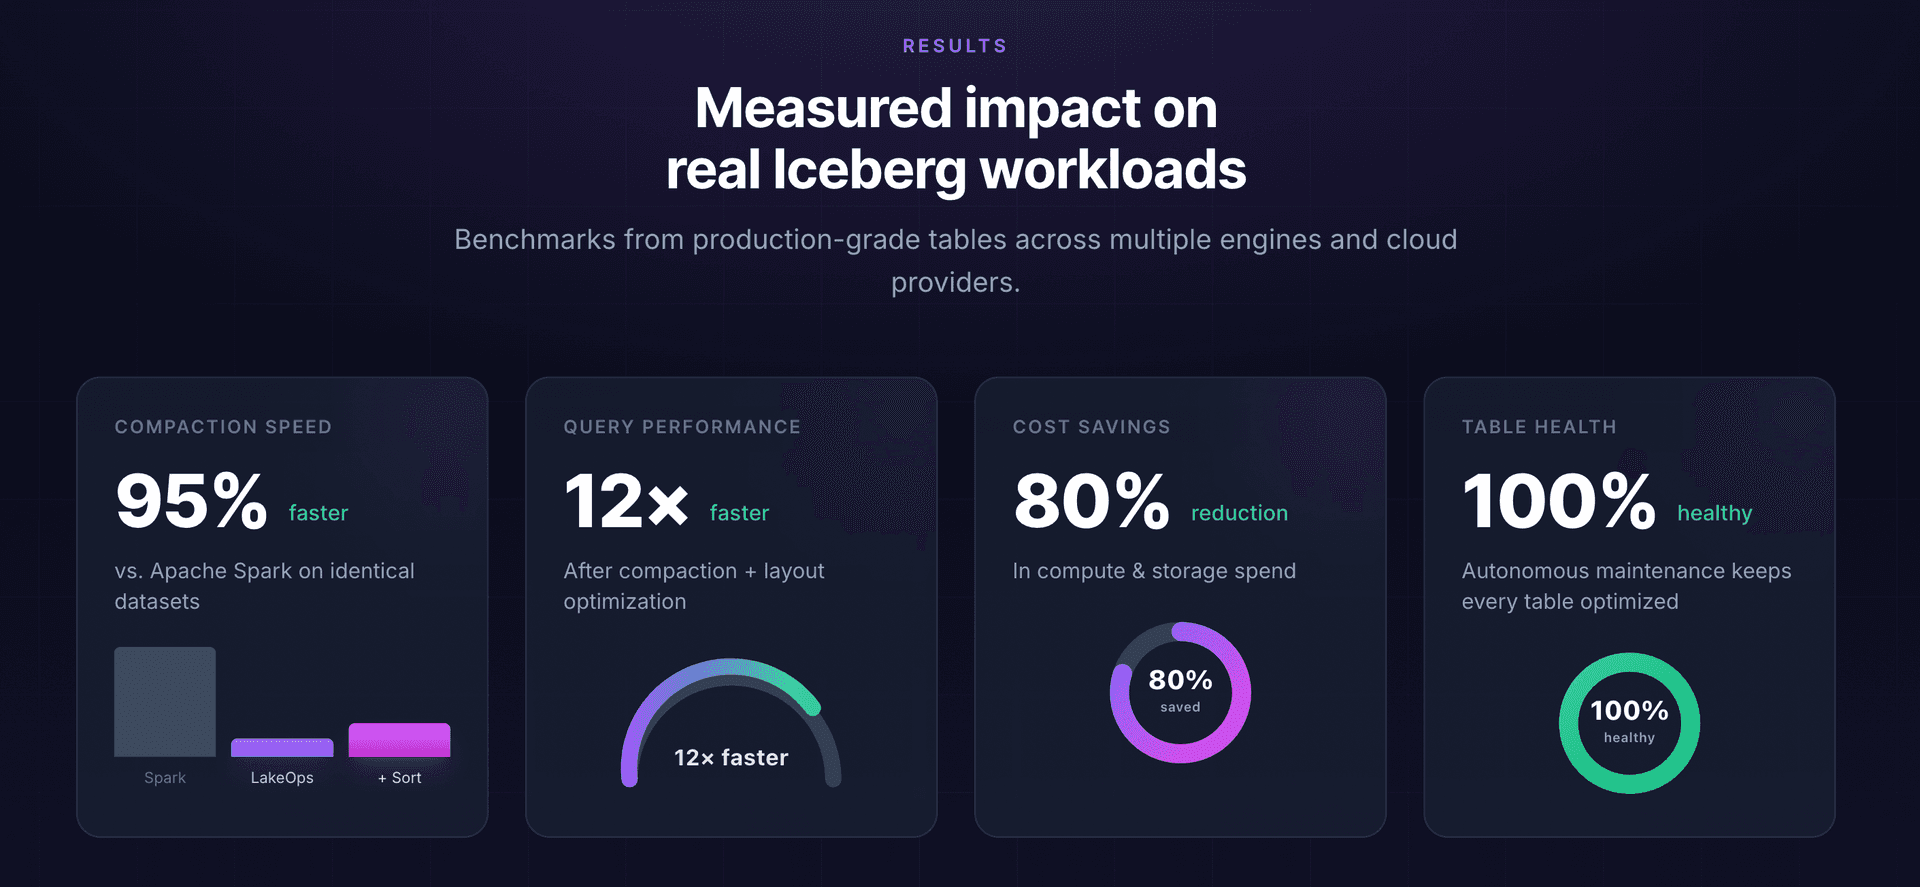
Why it causes slowness: Sort order is the single most impactful lever for Iceberg query performance. Sorted tables scan up to 51% less data per query than unsorted ones. With query-aware sort orders aligned to production filter patterns, file skipping can eliminate 80–95% of files during planning, producing up to 12x faster queries.
Diagnose it
Check the current sort order:
1-- Spark: check table sort order2DESCRIBE EXTENDED catalog.db.my_table;3-- Look for 'Sort Columns' in the outputCheck whether min/max ranges actually enable pruning. Wide, overlapping ranges indicate poor or missing sort order:
1-- Spark: check column value ranges across files2SELECT3 COUNT(*) AS total_files,4 MIN(lower_bounds['customer_id']) AS global_min,5 MAX(upper_bounds['customer_id']) AS global_max,6 COUNT(DISTINCT lower_bounds['customer_id']) AS distinct_lower_bounds7FROM catalog.db.my_table.files;If distinct_lower_bounds is close to 1 (all files have the same lower bound), your data is unsorted on that column and pruning cannot work.

Root cause 3: Manifest bloat
Symptoms: Query planning is slow even on small result sets. The planning phase dominates total query time. Cold-start queries are disproportionately slow compared to repeated queries.
Why it happens: Every commit — every streaming checkpoint, batch append, compaction, or MERGE operation — creates at least one new manifest file. A streaming table with 10-minute checkpoints accumulates over 4,300 manifests per month. Each manifest may only track a handful of files, creating a fragmented metadata layer.
Why it causes slowness: During query planning, the engine reads every manifest referenced by the current snapshot. Hundreds of small manifests mean hundreds of S3 GETs just to build the file list. Manifest caching helps on repeated queries, but cold-start planning — the first query after a cluster restart, or against a table you have not queried recently — pays the full I/O cost. Tables with 500+ manifests routinely see planning times of 5–15 seconds.
Diagnose it
1-- Spark: manifest count and fragmentation2SELECT3 COUNT(*) AS manifest_count,4 ROUND(AVG(added_data_files_count), 1) AS avg_files_per_manifest,5 SUM(CASE WHEN added_data_files_count <= 2 THEN 1 ELSE 0 END) AS tiny_manifests,6 ROUND(AVG(length) / 1024, 1) AS avg_manifest_size_kb7FROM catalog.db.my_table.manifests;1-- Trino: manifest count2SELECT3 COUNT(*) AS manifest_count,4 ROUND(AVG(added_data_files_count), 1) AS avg_files_per_manifest5FROM "catalog"."db"."my_table$manifests";If manifest_count exceeds 100 or avg_files_per_manifest is below 10, manifest rewriting will improve planning time. If more than 50% of manifests are tiny_manifests (tracking 1–2 files), the improvement will be dramatic.

Root cause 4: Stale snapshots pinning dead data
Symptoms: Storage volume grows faster than ingestion rate. Old data files that should have been deleted are still on disk. S3 LIST operations are slow. Metadata files keep growing.
Why it happens: Every write, update, and delete in Iceberg creates a new snapshot. Snapshots reference manifest lists, which reference manifests, which reference data files. Until a snapshot is explicitly expired, every data file it references is retained — even files that have been logically replaced by compaction or rewritten by MERGE operations. Without running expire_snapshots, the table accumulates an unbounded history of dead data files and metadata.
Why it causes slowness: Stale snapshots do not directly slow query execution (queries only read the current snapshot), but they create indirect pressure. Dead data files inflate S3 LIST response sizes, slowing maintenance operations. The growing metadata.json file takes longer to parse. In extreme cases, the volume of dead files causes S3 request throttling (503 SlowDown errors), which affects reads on the same prefix. Metadata that should fit in coordinator memory spills to disk, slowing planning.
Diagnose it
1-- Spark: snapshot accumulation2SELECT3 COUNT(*) AS total_snapshots,4 MIN(committed_at) AS oldest_snapshot,5 MAX(committed_at) AS newest_snapshot,6 DATEDIFF(MAX(committed_at), MIN(committed_at)) AS snapshot_span_days7FROM catalog.db.my_table.snapshots;1-- Trino: snapshot accumulation2SELECT3 COUNT(*) AS total_snapshots,4 MIN(committed_at) AS oldest_snapshot,5 MAX(committed_at) AS newest_snapshot6FROM "catalog"."db"."my_table$snapshots";If total_snapshots exceeds 1,000 or snapshot_span_days exceeds 30, you are retaining too much history. For most production tables, 5–7 days of snapshot retention is sufficient for time-travel needs.
Root cause 5: Partition misalignment
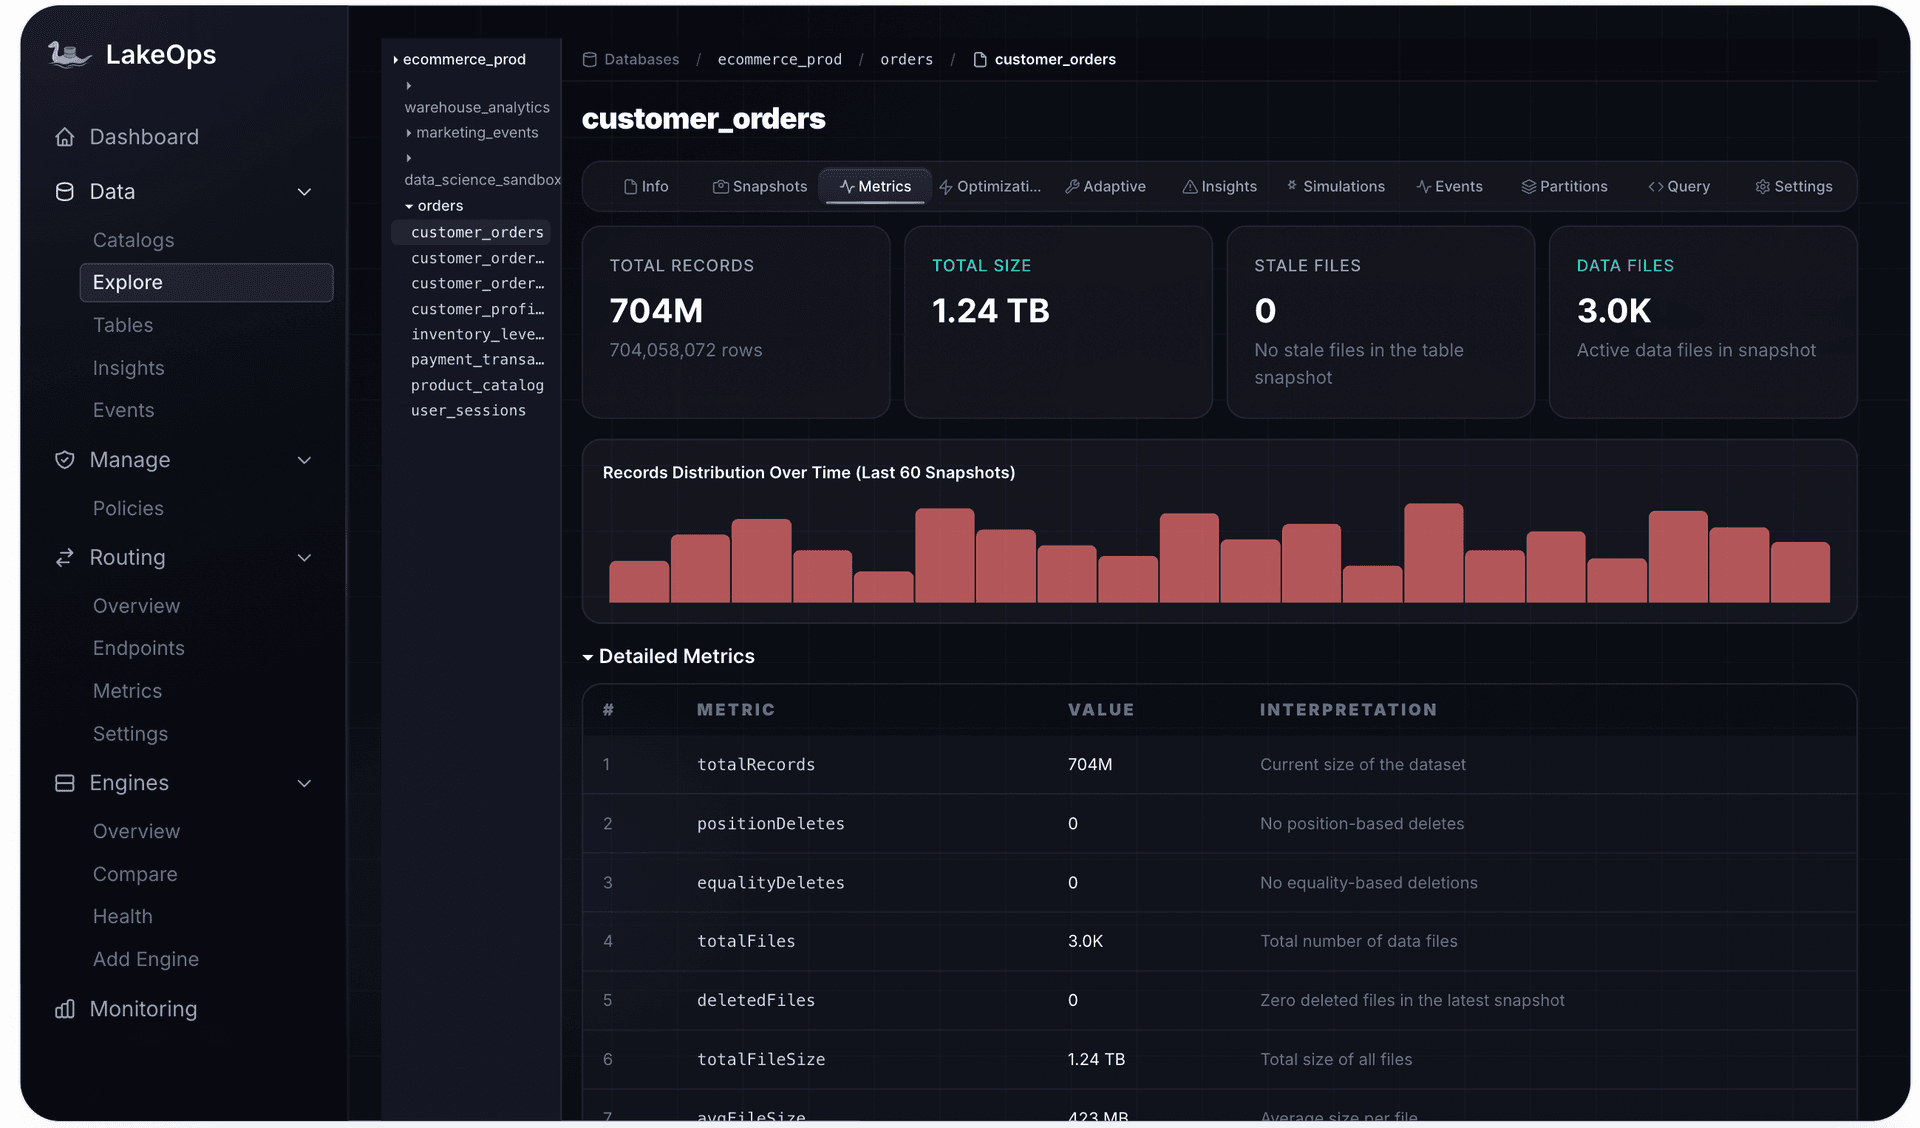
Symptoms: Queries scan far more partitions than expected. Partition pruning is ineffective. Some partitions have millions of rows while others have dozens. Adding new filter predicates does not reduce scan time.
Why it happens: The table was partitioned by the wrong column, at the wrong granularity, or the data distribution has changed since the table was created. Common mistakes: partitioning by day on a table mostly queried by region, using hourly partitions on a low-volume table (producing thousands of tiny partitions), or using identity partitioning on a high-cardinality column. Iceberg's partition evolution solves this without rewriting data, but many teams do not know it exists or are unsure how to apply it.
Why it causes slowness: Partition pruning is Level 1 filtering — the coarsest and cheapest form of data skipping. If queries filter on columns that are not part of the partition spec, the engine must read all manifests and evaluate all files. If partitions are too granular, each partition contains too few rows and too many small files. If partitions are too broad, each partition contains too much irrelevant data that gets scanned.
Diagnose it
1-- Spark: partition distribution2SELECT3 partition,4 COUNT(*) AS file_count,5 SUM(record_count) AS total_records,6 ROUND(SUM(file_size_in_bytes) / 1073741824, 2) AS partition_gb,7 ROUND(AVG(file_size_in_bytes) / 1048576, 1) AS avg_file_mb8FROM catalog.db.my_table.files9GROUP BY partition10ORDER BY file_count DESC11LIMIT 20;Look for partitions with very high file counts (thousands of files per partition) and partitions with tiny partition_gb values (under 100 MB). Both indicate misalignment. Also check if the partition column matches your most common query predicates — if you always filter by region but the table is partitioned by event_date, partition pruning helps only date-range queries.

The full diagnostic checklist
Run these queries to build a complete health profile of any slow table:
1-- Spark: comprehensive table health check2 3-- 1. File statistics4SELECT5 COUNT(*) AS total_files,6 ROUND(AVG(file_size_in_bytes) / 1048576, 1) AS avg_file_mb,7 SUM(CASE WHEN file_size_in_bytes < 33554432 THEN 1 ELSE 0 END) AS small_files,8 ROUND(SUM(file_size_in_bytes) / 1073741824, 2) AS total_gb9FROM catalog.db.my_table.files;10 11-- 2. Manifest health12SELECT13 COUNT(*) AS manifest_count,14 ROUND(AVG(added_data_files_count), 1) AS avg_files_per_manifest15FROM catalog.db.my_table.manifests;16 17-- 3. Snapshot accumulation18SELECT19 COUNT(*) AS total_snapshots,20 MIN(committed_at) AS oldest,21 MAX(committed_at) AS newest22FROM catalog.db.my_table.snapshots;23 24-- 4. Partition skew25SELECT26 partition,27 COUNT(*) AS file_count,28 ROUND(AVG(file_size_in_bytes) / 1048576, 1) AS avg_file_mb29FROM catalog.db.my_table.files30GROUP BY partition31ORDER BY file_count DESC32LIMIT 10;This gives you a health scorecard: file sizes tell you about compaction need, manifest counts tell you about planning overhead, snapshot counts tell you about metadata bloat, and partition distribution tells you about layout alignment. For a deeper look at how these metrics interact across the optimization stack, see the Iceberg lakehouse performance guide.
Once you have diagnosed the problems, you have two paths forward.

Path 1: Intelligent continuous optimization with LakeOps
LakeOps is an autonomous control plane for Apache Iceberg that treats all five root causes as facets of a single problem: table health. Instead of building separate cron jobs for compaction, manifest rewriting, snapshot expiry, and sort order management, LakeOps monitors every table continuously and applies the right optimization at the right time based on actual health signals.
Query-aware sort order. LakeOps collects query telemetry from every engine hitting your tables — Spark, Trino, Flink, Athena, Snowflake, DuckDB — and computes the optimal sort order for each table based on real filter patterns. The layout simulation feature lets you preview how different sort strategies affect file skipping before rewriting any data. Production results show up to 12x faster queries from sort order optimization alone.
Rust-based compaction engine. Rather than running Spark jobs to compact files, LakeOps uses a purpose-built Rust engine that merges small files into 256–512 MB targets with 95% less compute than Spark-based compaction. The engine applies the query-aware sort order during compaction, so files are consolidated and optimally sorted in a single pass.
Adaptive Maintenance. Instead of fixed cron schedules, LakeOps triggers maintenance based on table health signals: file size distribution, manifest count, snapshot age, and partition skew. Tables that are healthy get no unnecessary rewrites. Tables that are degrading get immediate attention. This prevents slow queries before they happen rather than reacting after users complain.

Table health monitoring. Every table is continuously classified as Healthy, Warning, or Critical based on its structural metrics. Warning and Critical tables are surfaced proactively, before they impact end users. You see at a glance which tables need attention and which are well-maintained — no diagnostic SQL required.
Manifest rewriting and snapshot lifecycle. LakeOps automatically consolidates fragmented manifests as part of the maintenance loop, grouping files by partition to maximize Level 1 pruning. Snapshot expiry, orphan file cleanup, and metadata compaction run on configurable retention policies, keeping the metadata layer lean without manual scheduling.
The net effect: every root cause in this guide is detected and resolved continuously, across every table in the lake, with optimization that adapts as data and query patterns change.
Path 2: The manual approach
If you prefer to manage optimization yourself, here is a production-ready maintenance script that addresses all five root causes. Schedule it with Airflow, Dagster, or any orchestrator:
1-- Step 1: Compact and sort small files (run daily for streaming tables)2CALL catalog.system.rewrite_data_files(3 table => 'db.my_table',4 strategy => 'sort',5 sort_order => 'customer_id ASC NULLS LAST, event_date ASC NULLS LAST',6 options => map(7 'target-file-size-bytes', '536870912',8 'min-file-size-bytes', '67108864',9 'min-input-files', '5',10 'partial-progress.enabled', 'true',11 'partial-progress.max-commits', '10'12 )13);14 15-- Step 2: Consolidate manifests (run weekly)16CALL catalog.system.rewrite_manifests(17 table => 'db.my_table'18);19 20-- Step 3: Expire old snapshots (run daily)21CALL catalog.system.expire_snapshots(22 table => 'db.my_table',23 older_than => TIMESTAMP '2026-07-26 00:00:00',24 retain_last => 5,25 stream_results => true26);27 28-- Step 4: Clean orphan files (run weekly)29CALL catalog.system.remove_orphan_files(30 table => 'db.my_table',31 older_than => TIMESTAMP '2026-07-29 00:00:00'32);For Trino, file compaction uses the optimize procedure:
1-- Trino: file compaction per partition2ALTER TABLE "catalog"."db"."my_table" EXECUTE optimize3 WHERE partition_col = 'value';Trino does not expose rewrite_manifests or expire_snapshots natively — those operations require Spark. If your primary engine is Trino, you will need a Spark sidecar for metadata maintenance.
Set table properties to encode retention and file size policies directly, so any engine or scheduler can respect them:
1-- Set retention and file size policies as table properties2ALTER TABLE catalog.db.my_table SET TBLPROPERTIES (3 'history.expire.max-snapshot-age-ms' = '604800000',4 'history.expire.min-snapshots-to-keep' = '5',5 'write.target-file-size-bytes' = '268435456'6);For partition evolution, Iceberg supports non-destructive changes to the partition spec:
1-- Spark: evolve partition scheme2ALTER TABLE catalog.db.my_table3ADD PARTITION FIELD bucket(16, customer_id);4 5-- Replace overly granular partitioning6ALTER TABLE catalog.db.my_table7REPLACE PARTITION FIELD hour(event_ts)8WITH day(event_ts) AS event_day;Partition evolution is a metadata-only operation — existing data retains its original layout. New writes follow the new partition spec. To apply the new layout to existing data, run a sort compaction after evolving the partition.
The manual path works for a handful of tables. The operational challenges emerge at scale: which tables actually need compaction today? What sort order should each table use? Are manifests accumulating faster than the weekly rewrite clears them? Has the partition scheme drifted from current query patterns? These are the questions that turn a simple cron job into a multi-table, cross-engine optimization system.
Measuring the impact
After applying fixes — either path — validate the improvement with the same diagnostic queries from above. Track these metrics over time:
- Average file size: Should be 256–512 MB after compaction. Monitor for regression after streaming commits.
- Manifest count: Should drop 5–10x after rewriting. Track weekly growth rate.
- Planning time: Measure wall-clock time from query submission to first row returned. Expect 2–5x improvement from compaction and manifest rewriting combined.
- Data scanned: Compare bytes scanned per query before and after sort order optimization. Expect 50–90% reduction for queries aligned with the sort order.
- Snapshot count: Should stabilize at your retention target (5–10 snapshots for most tables).
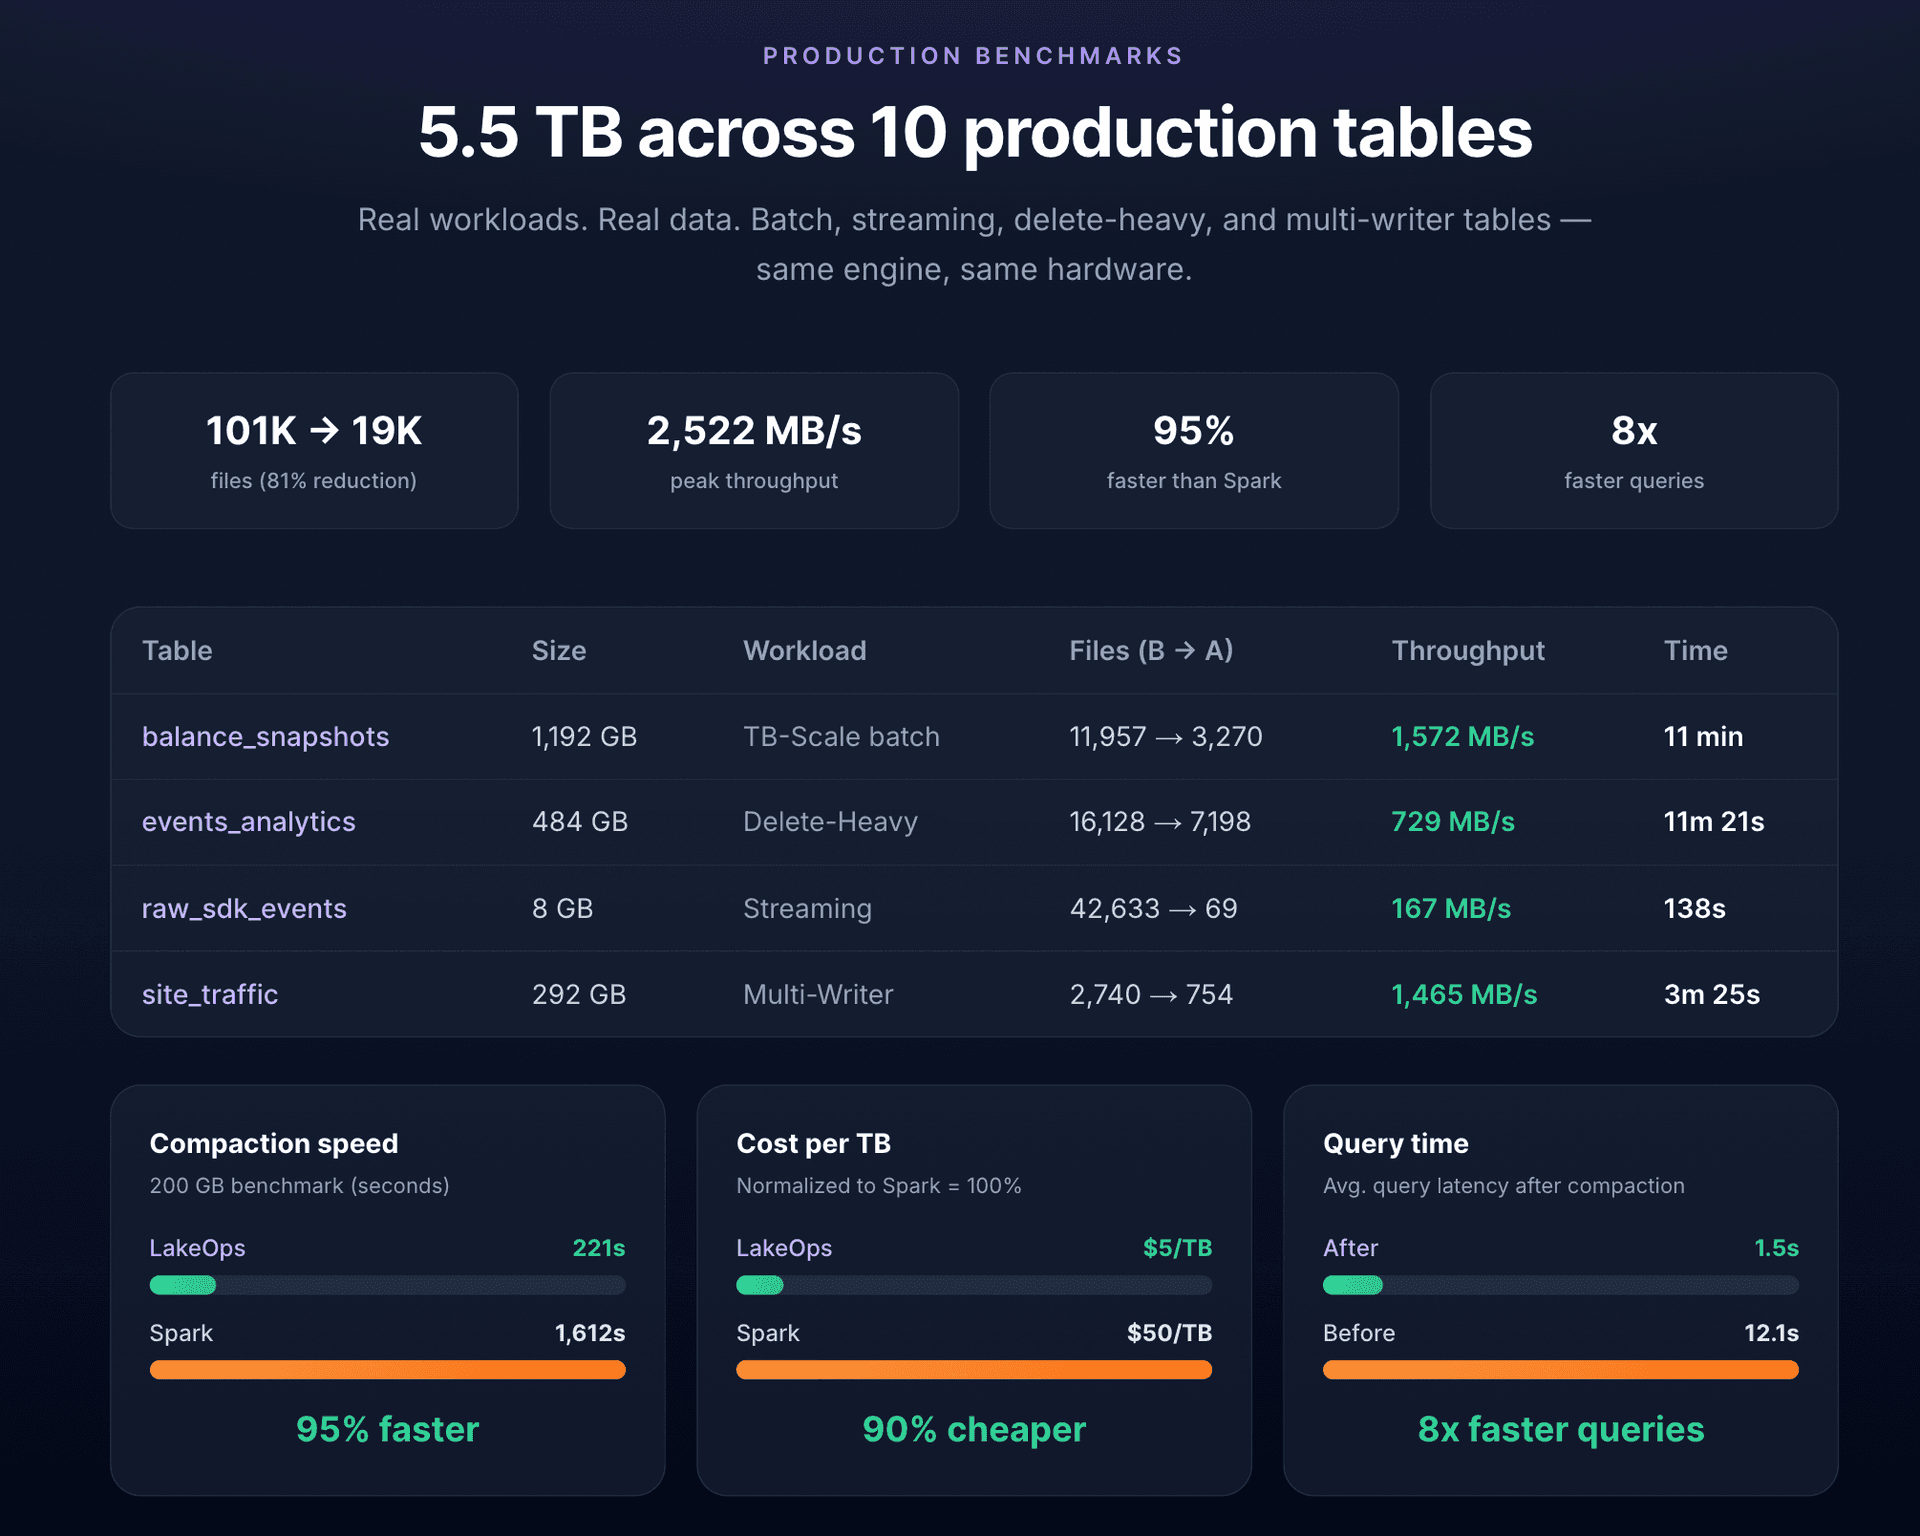
Conclusion
Slow Iceberg queries are not a mystery. They are a structural problem with five specific root causes, each diagnosable with SQL and fixable with standard Iceberg procedures. The challenge is not knowing what to do — it is doing it continuously, across every table, as data patterns and query patterns evolve.
The diagnostic queries in this guide give you immediate visibility into which tables are degraded and why. The manual procedures give you the tools to fix them. For teams managing more than a handful of tables — or anyone who wants optimization that adapts to real query patterns rather than relying on static configurations set months ago — LakeOps provides autonomous, query-aware optimization that delivers measurable query performance improvement without manual intervention.
Compaction, sort order, manifest rewriting, snapshot lifecycle, and partition alignment are not five separate problems — they are five facets of table health. Treat them together, measure them continuously, and your Iceberg queries will be as fast as the format was designed to deliver.
Further reading
- Iceberg Puffin Statistics Guide — how column statistics power file skipping and query planning\n- Iceberg Delete Files & Merge-on-Read — the hidden source of read amplification\n- Iceberg Partitioning Best Practices — aligning partition layout with query patterns