
Data quality is the single most expensive unsolved problem in data engineering. Gartner estimates that poor data quality costs organizations an average of $12.9 million per year — and projects that 85% of AI projects fail due to data quality issues, not model issues. But the headline numbers understate the real damage: the most costly failures are the ones nobody catches until a business decision has already been made on bad data, a machine learning model has been retrained on corrupted features, or a RAG pipeline has indexed stale definitions that quietly drift from what the business actually means.
For teams running Apache Iceberg lakehouses, the challenge compounds daily. Tables multiply. Engines proliferate. Pipelines grow more complex. The gap between "data that exists" and "data you can trust" widens with every new source, every schema evolution, and every silent upstream change that shifts distributions without breaking schemas. Gartner projects that 50% of enterprises will adopt data observability tools by 2026, up from under 20% in 2024 — acknowledging that periodic audits no longer keep pace with modern data architectures.
Traditional approaches — rule-based checks in Great Expectations, dbt tests, custom SQL assertions — catch what you anticipate. They miss what you don't. And they scale linearly with human attention, which does not scale at all.
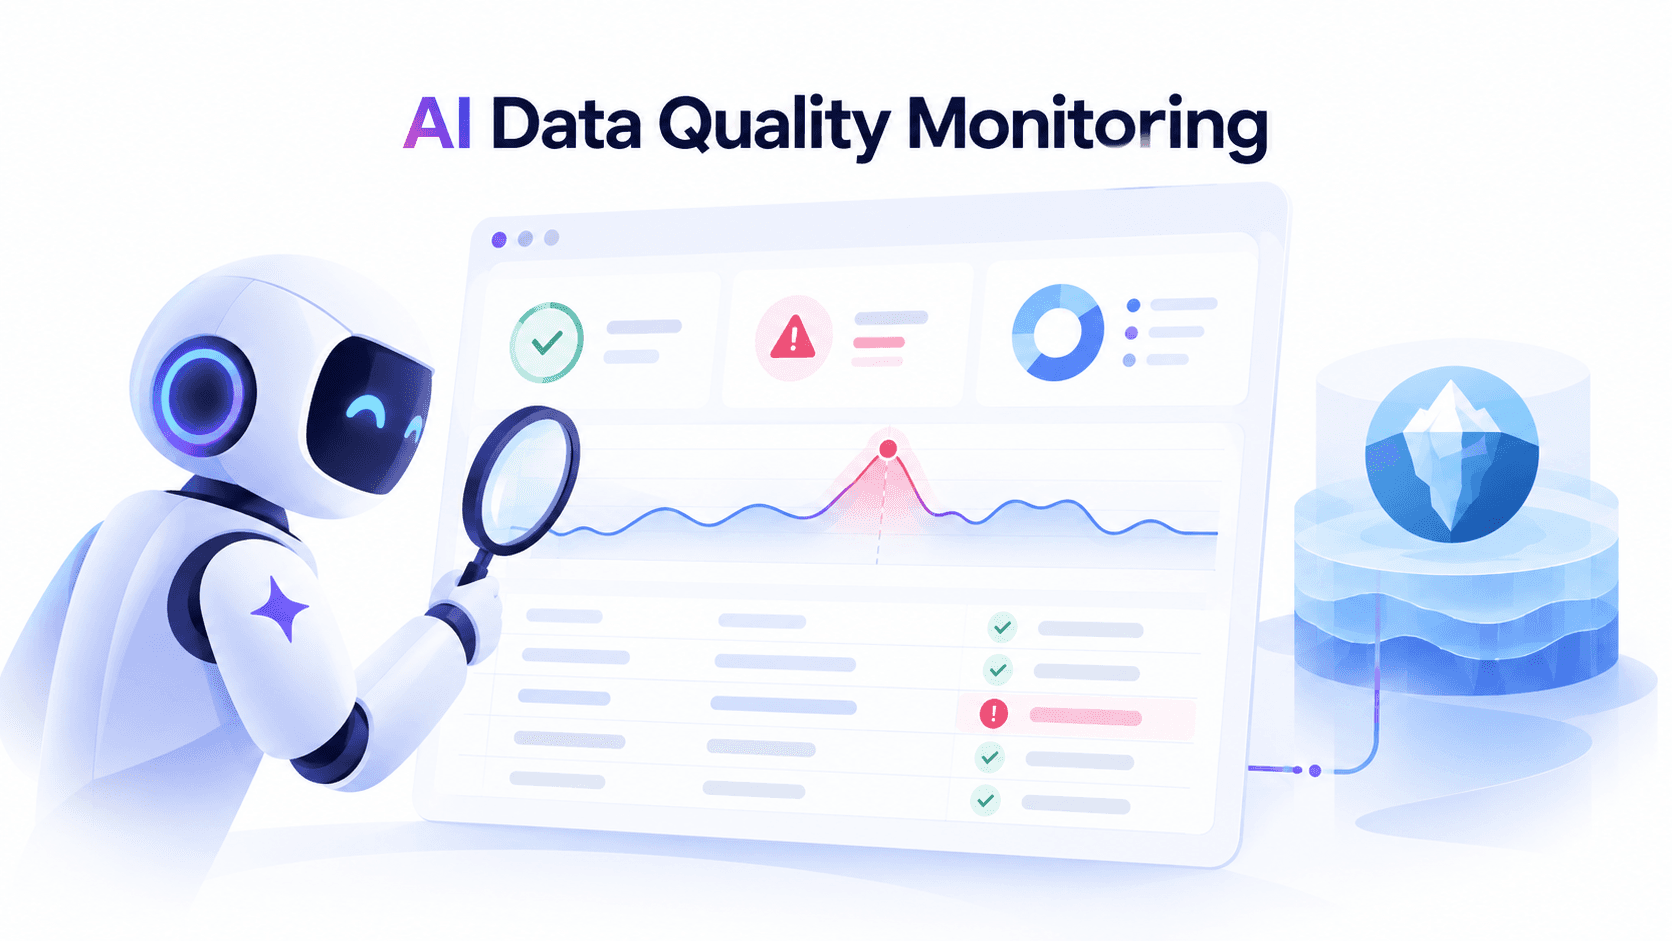
AI agents change this equation. Not by replacing rules, but by adding a reasoning layer that detects novel anomalies, correlates signals across tables, understands context, and takes action — continuously, across hundreds of tables, without waiting for a human to write the next check.
This guide covers how AI agents monitor data quality and detect anomalies on Iceberg tables, the categories of issues they catch that rules cannot, how zero-scan metadata techniques make continuous monitoring practical at scale, and how LakeOps provides the observability foundation and MCP interface that turns agents into operational data quality monitors.
The DIY Quality Stack: Why Traditional Approaches Hit a Ceiling
Most data teams cobble together a monitoring stack from five or six different tools: Great Expectations or Soda for rule-based checks, custom SQL assertions in dbt, Grafana dashboards for visualization, PagerDuty or OpsGenie for alerting, manual investigation in Jupyter notebooks, and a spreadsheet tracking which tables have coverage and which don't. Each tool does its job. The problem is that nobody does the job of connecting them.
Rule-based tools have earned their place. A dbt test that asserts NOT NULL on a primary key catches a real class of bugs. A Great Expectations suite that validates value ranges is genuinely useful. But the limitations emerge along three axes.
You can only test what you anticipate. A rule checking whether order_total falls between $0 and $100,000 catches obvious outliers. It does not catch a subtle distribution shift where the median order value drops 40% because a pricing service started returning values in cents instead of dollars. The values are all "valid" — they just mean something different. This is what researchers now call a failure of semantic integrity: the data passes structural checks while its meaning has quietly drifted.
Rules don't correlate across tables. A freshness check on customer_orders tells you the table was updated 15 minutes ago. It does not tell you that payment_transactions — which should have a corresponding record for every order — stopped receiving data two hours ago. The inconsistency only becomes visible when you reason across both tables simultaneously. Cross-table reasoning is the single largest blind spot in rule-based quality systems.
Maintenance burden grows linearly. Every new table, every schema change, every new data source requires new rules. At 500 tables across multiple catalogs, the rule maintenance itself becomes a full-time job — and the rules inevitably lag behind the data. Teams report spending 30–40% of their data engineering capacity on quality rule maintenance rather than building new capabilities.
The alert-to-resolution gap is where hours vanish. Even when rules do fire, the alert says "null rate exceeded threshold." A human must then open a notebook, write SQL, query metadata tables, check related tables, examine partition-level distributions, review recent schema changes, and correlate with maintenance events. The diagnosis takes 2–4 hours — for a single table. Multiply across a lake of hundreds of tables and the on-call rotation becomes unsustainable.
AI agents complement these tools by adding pattern recognition across time, correlation across tables, contextual reasoning about what "anomalous" means for a specific table's history, and the ability to investigate and diagnose — not just flag.
Zero-Scan Data Quality: Why Iceberg Changes the Game
Before examining what agents can do, it's worth understanding why Iceberg makes AI-driven quality monitoring fundamentally more practical than it is on other storage formats.
Apache Iceberg computes and stores rich metadata at write time as part of file writing: commit timestamps, record counts, and column-level statistics including null counts, NaN counts, and value bounds. These statistics serve query planning, yet they overlap substantially with data quality monitoring needs. A landmark LinkedIn study across 200,000+ Iceberg tables (800+ PB) demonstrated that this metadata-first approach satisfies approximately 60% of user-defined quality rules at zero marginal compute cost — no data scanning required.
The implications are profound. A traditional quality check against a 4 TB table requires a full scan — minutes of compute time and significant cost. The same check against Iceberg manifest metadata takes milliseconds. This makes continuous monitoring economically viable even across thousands of tables.
Extending manifest statistics with lightweight counters (sum, zero-value counts, boolean counts) and incrementally mergeable sketches — Theta sketches for distinct counts, KLL sketches for quantiles stored in Puffin sidecar files — can raise metadata-satisfiable coverage to close to 90% of production quality rules. This is the foundation that makes AI agent monitoring practical: agents can reason about data quality signals without triggering expensive scans on every cycle.
The AI Agent Advantage: Reasoning About Data Quality Holistically
An AI agent monitoring data quality operates fundamentally differently from a rule engine. Where a rule evaluates a single predicate against a single table, an agent reasons.
Consider what happens when null rates on a customer_email column jump from 0.3% to 12%. A rule fires: "null rate exceeded threshold." A human must then investigate manually.
An AI agent does this investigation autonomously. It queries schema history for recent evolution. It examines snapshot metadata to identify when the shift started. It checks related tables — did user_profiles also see a null spike? It looks at partition-level distributions to determine whether the issue is global or localized. It produces a diagnosis: "Null rate increase started at snapshot #4,812, coinciding with a new ingestion job writing to partition region=APAC. The user_profiles table shows a corresponding increase for the same region. Likely cause: upstream API change in the APAC user service."
Rules detect. Agents diagnose.
What Agents Can Reason About
Agents leverage Iceberg's metadata to reason across multiple dimensions simultaneously:
- Temporal patterns: Is this Tuesday's volume drop consistent with historical Tuesdays, or is it a real anomaly?
- Cross-table consistency: Do record counts in the fact table align with the dimension table?
- Structural context: Did the distribution shift happen before or after the last compaction run?
- Severity assessment: A 50% volume drop on December 25th is expected; the same drop on a Wednesday in March is not.
- Semantic integrity: Has the business meaning of a field drifted from what downstream models and dashboards expect, even though structural checks pass?
- Downstream impact: Which dashboards, ML models, and downstream tables consume this data — and what's the blast radius of the anomaly?
Seven Categories of Data Quality Issues AI Agents Detect
1. Statistical Anomalies: Distribution Shifts, Null Spikes, and Cardinality Changes
The hardest category to catch with static rules. Statistical anomalies are changes in the shape of data that don't violate any individual constraint but indicate something has changed upstream.
- Distribution shifts: The
transaction_amountP50 moved from $47 to $0.47 — every value is within range, but the distribution has fundamentally changed. The agent spots this by comparing manifest-level statistics against a historical baseline. - Null rate anomalies: A column that was 99.8% complete is now 85% complete. Iceberg manifests store per-file, per-column null counts — the agent aggregates these without scanning data files.
- Cardinality changes: The
country_codecolumn historically has 195 distinct values. Today it has 12 — or 847. Either direction indicates a problem. With Puffin-stored Theta sketches, agents can check approximate distinct counts from metadata alone. - Volume anomalies: The table received 2.3 million records yesterday versus a 30-day average of 3.1 million. The agent evaluates whether this falls within normal variance or represents a significant deviation.
- Standard deviation spikes: The variance on
delivery_time_hoursjumped 3x while the mean stayed constant — indicating a bimodal distribution that suggests two different fulfillment processes are now writing to the same table.
1-- Agent-generated: Compare current null rates to 30-day baseline2WITH current_stats AS (3 SELECT4 SUM(null_value_counts['customer_email']) AS current_nulls,5 SUM(value_counts['customer_email']) AS current_total6 FROM catalog.db.customer_orders.files7 WHERE snapshot_id = (SELECT MAX(snapshot_id) FROM catalog.db.customer_orders.snapshots)8),9baseline AS (10 -- Historical baseline from agent's monitoring state11 SELECT 0.003 AS expected_null_rate -- 0.3% historical average12)13SELECT14 ROUND(c.current_nulls * 100.0 / NULLIF(c.current_total, 0), 2) AS current_null_pct,15 b.expected_null_rate * 100 AS baseline_null_pct,16 CASE17 WHEN (c.current_nulls * 1.0 / NULLIF(c.current_total, 0)) > b.expected_null_rate * 518 THEN 'ANOMALY: Null rate 5x above baseline'19 ELSE 'NORMAL'20 END AS assessment21FROM current_stats c22CROSS JOIN baseline b;2. Schema Drift and Evolution Anomalies
Iceberg tracks schema evolution through immutable field IDs, making every change visible in metadata history. A new column on a staging table is routine. A column dropped from a production fact table feeding 12 dashboards is an incident. A type change from LONG to STRING on a join key silently breaks downstream joins. The agent understands these distinctions because it has context about usage patterns and dependencies.
- Unexpected column drops on tables with known consumers
- Type changes that break downstream queries (especially on partition or join keys)
- Required-to-optional transitions introducing nullability where none existed
- Column additions that duplicate existing semantics (e.g.,
user_idanduseridin the same table) - Partition key changes that alter how data is physically organized, breaking time-travel queries and compaction strategies
1-- Agent-generated: Detect schema changes between snapshots2SELECT3 s.snapshot_id,4 s.committed_at,5 s.schema_id,6 LAG(s.schema_id) OVER (ORDER BY s.committed_at) AS prev_schema_id,7 CASE8 WHEN s.schema_id != LAG(s.schema_id) OVER (ORDER BY s.committed_at)9 THEN 'SCHEMA_CHANGE_DETECTED'10 ELSE 'NO_CHANGE'11 END AS schema_status12FROM catalog.db.customer_orders.snapshots s13ORDER BY s.committed_at DESC14LIMIT 20;3. Freshness and Completeness Issues
Freshness — how recently a table was updated — is the highest-signal data quality metric. If a table's SLA requires data no older than 15 minutes and the last commit was three hours ago, something is broken upstream. But raw freshness alone is insufficient. An AI agent adds nuance:
- Expected arrival patterns: A table receiving hourly batches should alarm at 90 minutes of staleness. One receiving data every 5 minutes should alarm at 15. The agent learns these patterns from commit history.
- Missing partitions: The
daily_eventstable has data for every day in 2026 except June 14th. No rule checked for the gap — the agent notices. - Partial loads: The table was updated 10 minutes ago, but only 12,000 records were written versus an expected 1.2 million. Technically fresh, practically incomplete.
- Late-arriving data: Records arriving 48 hours after their event timestamp, landing in partitions downstream processes have already consumed.
- Stale statistics: Puffin statistics that have drifted 50+ snapshots from reality, causing query planners to make suboptimal decisions that look like data quality problems to consumers.
4. Referential Integrity Violations Across Tables
The most underserved category. Referential integrity between tables is almost never checked because it requires cross-table reasoning that rule-based systems handle poorly. An AI agent continuously validates:
- Every
order_idinorder_line_itemshas a corresponding record incustomer_orders product_idvalues in the fact table are a subset of theproduct_catalogdimension- Record counts between a source table and its derived aggregation are consistent
- Temporal consistency: the latest timestamp in a downstream table is never newer than its source
- Join key cardinality: when a foreign key in a fact table references more distinct values than exist in the dimension, orphan records indicate a pipeline sequencing problem
1-- Agent-generated: Detect orphan records in fact table2SELECT COUNT(*) AS orphan_orders3FROM catalog.db.order_line_items oli4LEFT JOIN catalog.db.customer_orders co5 ON oli.order_id = co.order_id6WHERE co.order_id IS NULL7 AND oli.event_date >= CURRENT_DATE - INTERVAL '1' DAY;5. Data Volume and Velocity Anomalies
Sudden spikes or drops often indicate pipeline issues that no row-level check catches. An agent maintains a statistical model of expected volumes per table, partition, and time window:
- Volume drops: A 60% decrease in daily record count for
clickstream_eventsindicates a pipeline failure, not a legitimate decrease in activity. - Volume spikes: A 10x increase in
error_logsover 4 hours suggests a production incident — the data is "correct" but the volume is the signal. - Partition imbalance: One partition received 500,000 records while adjacent partitions received 50,000 — a retry storm, hot key, or upstream change.
- Write velocity shifts: The table went from 3 commits per hour to 30 — consistent with a streaming job restarting with smaller batches, creating small files that degrade query performance.
1-- Agent-generated: Detect volume anomalies across recent snapshots2WITH snapshot_volumes AS (3 SELECT4 s.snapshot_id,5 s.committed_at,6 s.summary['added-records'] AS records_added,7 LAG(s.summary['added-records'], 1) OVER (ORDER BY s.committed_at) AS prev_records,8 AVG(CAST(s.summary['added-records'] AS BIGINT))9 OVER (ORDER BY s.committed_at ROWS BETWEEN 30 PRECEDING AND 1 PRECEDING) AS avg_30_commits10 FROM catalog.db.clickstream_events.snapshots s11 WHERE s.committed_at >= CURRENT_TIMESTAMP - INTERVAL '7' DAY12)13SELECT14 snapshot_id,15 committed_at,16 records_added,17 ROUND(avg_30_commits) AS baseline_avg,18 CASE19 WHEN CAST(records_added AS DOUBLE) < avg_30_commits * 0.3 THEN 'VOLUME_DROP'20 WHEN CAST(records_added AS DOUBLE) > avg_30_commits * 5.0 THEN 'VOLUME_SPIKE'21 ELSE 'NORMAL'22 END AS assessment23FROM snapshot_volumes24ORDER BY committed_at DESC25LIMIT 10;6. Duplicate and Consistency Anomalies
Duplicates are among the most insidious quality issues because they don't trigger null checks, type checks, or range checks. An agent detects:
- Exact duplicates: Identical records from retry storms or at-least-once delivery semantics
- Near-duplicates: Records with the same business key but different timestamps, suggesting double-processing
- Cross-partition duplication: The same
event_idappearing in two daily partitions due to late-arriving data being reprocessed - Aggregation drift: A derived table shows 5% more revenue than the sum of its source records — the derivation logic has quietly changed
7. Encoding and Format Anomalies
The subtlest category — data that looks correct in metadata but behaves unexpectedly in practice:
- Timezone shifts: Timestamps that were in UTC are now arriving in PST, shifting all time-based aggregations by 8 hours
- Currency mismatches: Revenue values that switched from USD to EUR mid-stream with no field to distinguish them
- Encoding changes: String columns that switched from UTF-8 to Latin-1, corrupting international characters
- Precision loss: Decimal columns that lost precision during a Parquet writer upgrade, rounding financial values
How AI Agents Monitor Iceberg Tables via MCP
How does an AI agent actually interact with Iceberg table metadata? Through the Model Context Protocol (MCP) — an open interface that exposes data operations as structured tool calls any LLM can invoke.
Rather than giving agents raw SQL access, MCP provides purpose-built tools for discovery, analysis, and governance. Agents call structured tools that return exactly the signals they need.
Discovery: What Tables Exist and What Do They Look Like?
The monitoring loop starts with discovery. An agent calls list_catalogs to enumerate all Iceberg catalogs, then search_tables to find tables by name, health status, or catalog scope. get_table_details returns size, record count, delete file ratios, and health status. get_schema reveals the column layout, partition strategy, and sort order. The agent rebuilds a complete picture from live metadata on every monitoring cycle.
Health Assessment: What's Degrading?
LakeOps table health scoring provides the foundation layer for AI agent monitoring. Every table is continuously classified as Healthy, Warning, or Critical based on structural signals: file count and size distribution, manifest fragmentation, snapshot depth, delete file accumulation, partition skew, and sort order alignment with actual query patterns.
This is the critical distinction from raw metadata queries. LakeOps doesn't hand the agent 47 raw metrics and expect it to determine what's wrong. It provides pre-computed health signals with actionable context: "This table is Warning because its small-file ratio is 42% and the APAC partition has 8,200 files versus a median of 340." The agent receives structured signals it can reason about — not a spreadsheet it has to interpret.
An agent calls get_table_insights to retrieve health insights explaining why a table is Warning or Critical, with specific recommendations. get_table_profile returns the combined maintenance profile — stats, insights, adaptive maintenance signals, and health scores — in a single call. get_hot_partitions reveals partition-level skew with a skew_signal when the hottest partition exceeds 10x the average.
Statistical Profiling: What Does the Data Look Like?
For deeper analysis, agents run profiling queries through the MCP run_query tool. Queries pass through LakeOps guardrails — ReadOnly blocks DDL/DML, CostEstimate rejects expensive scans, PIIMask hashes sensitive columns before results reach the model.
1-- Agent-generated profiling query (runs through MCP guardrails)2SELECT3 COUNT(*) AS total_records,4 COUNT(DISTINCT customer_id) AS unique_customers,5 SUM(CASE WHEN customer_email IS NULL THEN 1 ELSE 0 END) AS null_emails,6 ROUND(AVG(order_total), 2) AS avg_order_total,7 PERCENTILE_APPROX(order_total, 0.5) AS median_order_total,8 MIN(event_timestamp) AS earliest_record,9 MAX(event_timestamp) AS latest_record10FROM catalog.db.customer_orders11WHERE event_date >= CURRENT_DATE - INTERVAL '1' DAY;Cross-Table Correlation: What's Connected?
An agent monitoring customer_orders correlates findings with payment_transactions, shipping_events, and product_catalog. When the order table shows a volume drop, the agent checks whether the payment table shows a corresponding drop (upstream issue) or maintains normal volume (order-specific failure). This cross-table reasoning catches inconsistencies no single-table check would surface.
Historical Comparison: Is This Normal?
Agents maintain context across cycles, building implicit baselines — normal null rates, expected volume ranges, typical commit patterns. A 20% volume drop on a Sunday is normal seasonality. The same drop on a Wednesday warrants investigation.
The get_table_events tool returns operation history — compaction runs, snapshot expirations, orphan cleanups — allowing the agent to correlate anomalies with maintenance events. Did the distribution shift happen right after a compaction that changed sort order? That's a different root cause than a shift from a new ingestion job.
LakeOps: The Observability Foundation for Agentic Data Quality
LakeOps provides table health scoring across all your Iceberg tables — classifying every table as Healthy, Warning, or Critical based on structural signals. AI agents access these health signals through MCP tools, correlate anomalies across tables, and trigger remediation — all through a single control plane instead of stitching together five different tools.
How Health Scoring Works
| Signal | Healthy | Warning | Critical |
|---|---|---|---|
| Average file size | 128–512 MB | 32–128 MB | < 32 MB |
| Small file ratio | < 20% | 20–50% | > 50% |
| Manifest ratio | < 1:50 | 1:10–1:50 | > 1:10 |
| Delete-to-data ratio | < 0.1 | 0.1–0.5 | > 0.5 |
| Snapshot retention | Within policy | 2x policy | > 5x policy |
| Partition skew | < 5x median | 5–50x median | > 50x median |
Health state updates with every new commit — not on a polling schedule. This is what makes the health scoring layer critical for agents: the signals are always current, always structured, and always actionable.
Why Health Scoring Matters for Data Quality
Data quality and table health are independent failure modes, but they interact constantly. You can have perfect data quality on a structurally degraded table — every row is correct, but queries scan 10x more data than necessary because 50,000 small files have accumulated. You can also have perfect table health on a table with severe data quality issues — files are compacted and manifests are clean, but half the records have null values from a broken upstream pipeline.
An agent monitoring a table with 200,000 small files will report constant anomalies that are structural problems, not data quality issues. Without health scoring as a foundation layer, agents waste cycles diagnosing phantom quality issues that are actually maintenance gaps. LakeOps separates the signal: structural issues get remediated automatically, freeing the agent to focus on actual data quality anomalies.
Four-Severity Insights
LakeOps surfaces table-level Insights at four severity levels:
- CRITICAL: Actively broken. Freshness SLA breached by 5x, delete ratio above 0.8, partitions with 20,000+ files.
- HIGH: Significant degradation trending toward Critical. File size below 32 MB, manifest count exceeding 10% of file count.
- WARNING: Measurable drift. Partitions exceeding 1,000 files, sort order misaligned with recent queries.
- LOW: Minor sub-optimalities. Statistics age exceeding 48 hours, manifest count trending upward.
An AI agent triaging 500 tables starts with CRITICAL and works down — the same workflow a senior engineer would follow, executed continuously without fatigue or attention drift.
Replacing the DIY Stack
Consider what LakeOps replaces in a typical data quality monitoring setup:
| DIY Component | What It Does | LakeOps Equivalent |
|---|---|---|
| Custom monitoring scripts | Poll metadata tables for anomalies | Continuous health scoring with MCP access |
| Grafana dashboards | Visualize table metrics | Pre-computed health signals at four severity levels |
| PagerDuty rules | Alert on threshold breaches | Agent-consumed insights with structured context |
| Manual investigation | Diagnose root causes in notebooks | Agent-driven cross-table correlation and diagnosis |
| Tribal knowledge | "This table is always slow on Mondays" | Learned baselines with temporal pattern awareness |
The difference is not just automation — it's context. A PagerDuty alert says "small file ratio exceeded 50%." A LakeOps insight consumed by an AI agent says "small file ratio is 42% and trending Critical, driven by high-velocity CDC writes to the APAC partition without proportional compaction. Delete files are accumulating from the UPDATE stream. Recommended action: targeted compaction on APAC partition."
Automated Remediation: From Detection to Action
Detection without remediation is just sophisticated alerting. The real value emerges when agents act on what they find — diagnosing root causes, applying fixes, and escalating only when human judgment is genuinely required.
The Agent Remediation Loop
- 1.Detect: Agent identifies an anomaly — null spike, volume drop, health degradation, schema change.
- 2.Diagnose: Agent investigates the anomaly — queries related tables, checks event history, examines partition-level details, correlates with maintenance operations.
- 3.Classify: Agent determines whether the issue is a data quality problem (bad data), a structural health problem (degraded table), or a legitimate business change (expected variation).
- 4.Act: For structural issues, the agent triggers remediation via MCP governance tools. For data quality issues, it generates a detailed incident report with root cause analysis and recommended actions.
- 5.Verify: After remediation, the agent re-checks the table to confirm the fix was effective.
Structural Remediation via MCP
When a table degrades to Warning or Critical, the agent triggers remediation through LakeOps governance tools. The analyze_table_maintenance tool provides a full decision framework — including do-nothing decisions when maintenance cost exceeds benefit. For tables requiring action:
- Trigger compaction via
execute_policyto merge small files, apply deletes, and re-sort data - Initiate snapshot expiration to remove stale snapshots pinning storage
- Request manifest rewrites to consolidate fragmented manifests
- Schedule orphan cleanup to reclaim unreferenced files
LakeOps enforces the correct dependency sequence automatically — expire snapshots before orphan cleanup, compaction before manifest rewrite — the agent expresses intent and the platform handles execution safely.
1Agent: Analyzing table health for catalog.ecommerce.customer_orders...2 3Findings:4- Health: WARNING → trending Critical5- Small file ratio: 42% (threshold: 20%)6- Partition skew: region=APAC has 8,200 files vs. median of 3407- Delete-to-data ratio: 0.31 (threshold: 0.1)8- Last compaction: 6 days ago9 10Diagnosis: High-velocity CDC writes to APAC partition without11proportional compaction. Delete files accumulating from UPDATE stream.12 13Action: Executing compaction policy targeting APAC partition with14delete-file application. Expected result: 8,200 → ~80 files,15delete ratio → 0.0.16 17Verification scheduled: 30 minutes post-compaction.Human-in-the-Loop Escalation
Not every issue should be auto-remediated. A 50% null spike in a revenue column requires human judgment. The agent's role is to provide a complete diagnosis: what changed, when, in which partitions, which upstream sources are responsible, what downstream consumers are affected, and the blast radius if unaddressed.
This is the difference between "null rate exceeded threshold" and "the APAC user service API changed its email field from required to optional on June 12th, affecting 340,000 records across 12 partitions, impacting the marketing segmentation pipeline and three dashboards. Estimated downstream impact: 2 ML models and 47 queries in the last 30 days."
Building a Continuous Monitoring Loop
A production-grade AI agent monitoring system for Iceberg data quality operates as a continuous loop — not a scheduled job. Here's how to structure it.
Cycle 1: Lake-Wide Health Scan (Every 15 Minutes)
The agent calls get_lake_health for an org-wide summary, then search_tables filtered by status=CRITICAL and status=WARNING. For each degraded table, it retrieves insights via get_table_insights and prioritizes by severity. Tables in CRITICAL state get immediate detailed analysis; WARNING tables are queued for the next deep-scan cycle.
This cycle replaces: the Grafana dashboard refresh, the manual triage meeting, and the Slack message asking "is anyone looking at the clickstream table?"
Cycle 2: Deep Table Analysis (Hourly per Priority Tier)
For each table flagged in Cycle 1, the agent runs:
get_table_profilefor the combined health and maintenance signalget_partition_distributionto identify partition-level skewget_table_eventsto check recent maintenance operationsget_hot_partitionsto detect skew where the hottest partition exceeds 10x the average- Profiling queries via
run_queryfor statistical baselines (null rates, cardinality, volume)
The agent compares current values against its maintained baseline, flags deviations exceeding statistical thresholds, and produces a prioritized finding list.
Cycle 3: Cross-Table Consistency (Every 4 Hours)
The agent validates referential integrity and volume consistency across related table groups. This is where the highest-value anomalies surface — the inconsistencies between tables that no single-table check would catch. The agent checks that record counts in order_line_items are consistent with customer_orders, that payment_transactions has no orphan references, and that temporal ordering between source and derived tables is maintained.
Cycle 4: Remediation and Verification (Continuous)
For structural health issues, the agent triggers remediation and schedules verification checks. For data quality issues, it generates incident reports and routes them to the appropriate team. Every action is logged in the LakeOps event trail for full auditability.
The feedback loop closes when agent query patterns — the columns agents filter and join on — feed back into LakeOps compaction and sort-order decisions. Tables stay fast for the agents that monitor them, creating a virtuous cycle between observability and optimization.
LakeOps: The Control Plane for Agentic Data Quality
The architecture described above — AI agents reasoning about data quality across hundreds of Iceberg tables, correlating anomalies, triggering remediation, and operating in continuous loops — requires a control plane that provides three things: observability data the agent can consume, an MCP interface the agent can call, and a maintenance engine that can execute remediation safely.
LakeOps provides all three as a unified platform for Apache Iceberg lakehouses.
Observability as the data layer. Every table is continuously scored. Health signals update with every commit. Insights surface problems at four severity levels with specific recommendations. Cross-engine telemetry reveals which columns queries filter on, which sort orders are misaligned, and which tables have the highest read amplification. The agent doesn't need to build this picture from raw metadata queries — it's pre-computed and available through structured MCP tools.
MCP as the interface layer. 27 purpose-built tools spanning discovery, analysis, and governance — from list_catalogs to analyze_critical_triage to execute_policy. The agent auto-discovers available tools, calls them with structured parameters, and receives structured responses. No custom SDK, no integration code. Compatible with Claude, LangChain, Cursor, and any MCP-compatible agent framework. Full documentation at lakeops.dev/docs/mcp.
Autonomous maintenance as the execution layer. When an agent triggers remediation, LakeOps executes it on a Rust-based engine built on Apache DataFusion — 95% faster and 90% cheaper than Spark-based maintenance. Operations are sequenced automatically (expire → clean → compact → rewrite), non-blocking for concurrent readers, and fully logged with before-and-after metrics. The operational runbook covers the full maintenance lifecycle.
Guardrails as the safety layer. Agent queries pass through composable guards — ReadOnly blocks DDL/DML, CostEstimate rejects expensive scans, PIIMask hashes sensitive columns, HumanApproval pauses high-stakes operations. The agent operates within a trust boundary defined by the platform, not by the agent's own judgment. Every fired guard is logged with the query, creating a full audit trail of agent behavior.
Getting Started: A Practical Roadmap
Stage 1: Establish Visibility
Connect your Iceberg catalogs to LakeOps. Within minutes, every table is classified as Healthy, Warning, or Critical. Before deploying agents, understand which tables are structurally degraded — an agent monitoring a table with 200,000 small files will report constant anomalies that are structural problems, not data quality issues. This stage replaces the "build Grafana dashboards for each table" phase that most teams never finish.
Stage 2: Get Tables Healthy
Enable autonomous maintenance — compaction, snapshot expiration, manifest consolidation, orphan cleanup. An agent monitoring healthy tables produces meaningful data quality signals. An agent monitoring degraded tables produces noise. Table health is a prerequisite for effective data quality monitoring, not an optimization.
Stage 3: Deploy Agent Monitoring
Connect an AI agent to LakeOps via MCP. Start with the analyze_lake_health and analyze_critical_triage workflows to establish lake-wide visibility. Graduate to per-table monitoring with analyze_table_health and get_table_profile. Build cross-table consistency checks for your highest-priority table groups. Start with read-only monitoring and add remediation capabilities as confidence grows.
Stage 4: Close the Loop
Enable agent-triggered remediation for structural issues. Configure escalation workflows for data quality issues that require human judgment. The agent becomes the first responder — detecting, diagnosing, and resolving or escalating every data quality issue across your entire lake, continuously. Agent access patterns feed back into compaction and sort-order decisions, keeping tables optimized for both human analysts and AI agents.
Conclusion
Data quality monitoring on Apache Iceberg is evolving from static rule-based checks to AI-driven continuous monitoring — and the shift is accelerating. The Data-Centric AI paradigm places data quality at the core of the AI lifecycle, recognizing that model performance, robustness, and trustworthiness are primarily achieved through systematic data engineering rather than model re-engineering. For teams running Iceberg lakehouses, this means data quality is no longer a pre-launch cleanup task — it's an ongoing discipline that must be embedded in how data moves, how it gets governed, and how it gets consumed.
The technical foundation for this shift exists today. Iceberg's rich metadata architecture provides the signals — zero-scan quality checks that satisfy the majority of monitoring needs at zero marginal compute cost. MCP provides the interface — structured tools that any agent can discover and call. LakeOps provides the observability, health scoring, MCP tools, and autonomous maintenance engine that make agentic monitoring practical at scale.
The teams that adopt AI agents for data quality monitoring are not replacing their existing checks — they are adding a reasoning layer that catches the anomalies rules miss, correlates signals humans can't track manually, and responds faster than any on-call rotation. Start with visibility. Get your tables healthy. Deploy agents. Close the loop.
Your lakehouse has the metadata. The agents have the reasoning. LakeOps connects the two.