Multi-Engine Query Routing
Route every query to
the right engine
LakeOps routes queries across Trino, Spark, DuckDB, Snowflake, Athena, StarRocks, and Flink — optimizing for cost, latency, or throughput per workload. One policy layer, one endpoint, every engine. Up to 56% cost reduction with zero client changes.
Measured Impact
What routing delivers
Cost reduction
Workload-aware routing matches queries to optimal pricing models
Latency
Point lookups on DuckDB vs same query on Athena (0.5s vs 2.3s)
Proxy overhead
Rust-based routing adds negligible latency to query path
Benchmarks from queryflux-bench suite • Production Iceberg tables • Multi-cloud, multi-engine
How LakeOps optimizes routing
Five layers of
routing intelligence
From query-level dispatch to lake-wide table optimization — each layer compounds the value of routing by making more engines viable for more workloads.
Intelligent query routing
Every query on the best engine for its shape, cost, and latency target
LakeOps routes queries across Trino, Spark, DuckDB, Snowflake, Athena, StarRocks, and Flink based on query shape, latency targets, cost ceilings, and engine availability. Interactive queries hit sub-second engines. Heavy scans go where compute is strongest. Routing rules adapt as workload patterns evolve.
- Three optimization strategies: latency, cost, throughput — per routing group
- Up to 56% cost reduction by routing to the right pricing model
- DuckDB: 0.5s point lookups vs 2.3s on Athena for the same query
Optimize for: cost · performance · consumer
Routing groups & endpoints
Organize engines by workload — not by team or tool
Group engines into routing endpoints by workload type: storefront analytics on Trino + DuckDB, checkout transactions on Snowflake + StarRocks, catalog ETL on Athena + Spark. Each group has its own policies, capacity limits, and fallback rules — all managed from one console.
- Per-group concurrency limits and queue-based overflow
- Dedicated endpoints per workload (e.g. storefront-analytics.lakeops.dev)
- Add, remove, or swap engines without client changes
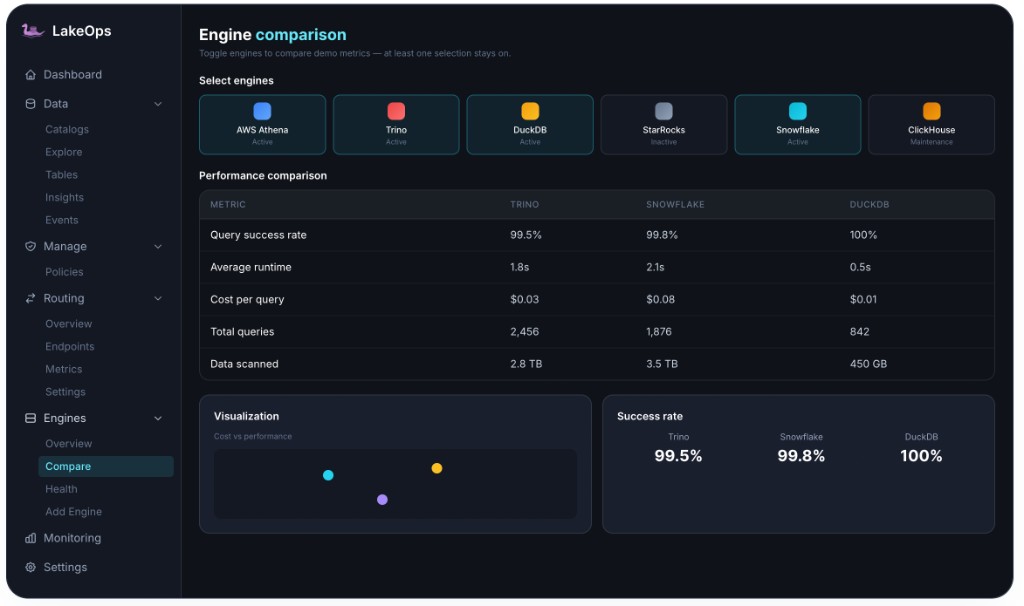
Engine comparison & health
Side-by-side engine metrics — cost, latency, throughput, success rate
Compare every registered engine across query success rate, average runtime, cost per query, total queries, and data scanned. Spot under-performing engines before they impact SLAs. View engine health, uptime, and resource signals in one place — then route traffic away from degraded backends automatically.
- Real-time comparison: cost/query, avg runtime, data scanned per engine
- Automatic failover when engine health degrades below threshold
- Historical trending to identify capacity bottlenecks before they hit
Table-aware optimization
Optimized tables unlock faster engines for more query shapes
Routing alone improves dispatch — but compacted, sorted tables unlock even more engines for any given query. LakeOps continuously optimizes file layout, manifests, and statistics so that engines like DuckDB and StarRocks can handle queries that previously required heavy distributed compute.
- Compacted tables reduce the minimum viable engine per query shape
- Puffin statistics enable more aggressive file-level pruning across all engines
- Sorted data + lean manifests = more queries eligible for sub-second engines
One policy layer, many engines
Eliminate per-engine scripts, configs, and operational drift
Define routing rules, capacity limits, fallback strategies, and optimization policies once. LakeOps applies them uniformly across every engine in your estate. No engine-specific scripts, no duplicate monitoring, no coordination overhead — one control plane governs the full topology.
- Unified policy: cost ceilings, latency targets, priority queues per group
- No N×M driver configurations — clients connect once
- Full audit trail: which query went where, why, and what it cost
Interactive BI → low-latency pool
ETL batch → compute-optimized
Ad-hoc exploration → cost-optimized
Streaming ingest → stream-native
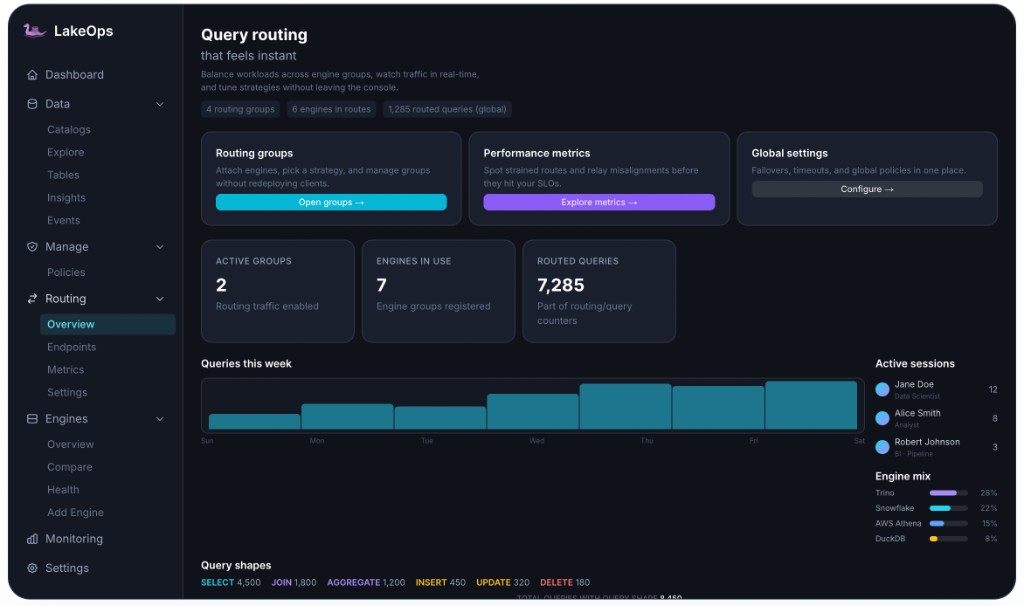
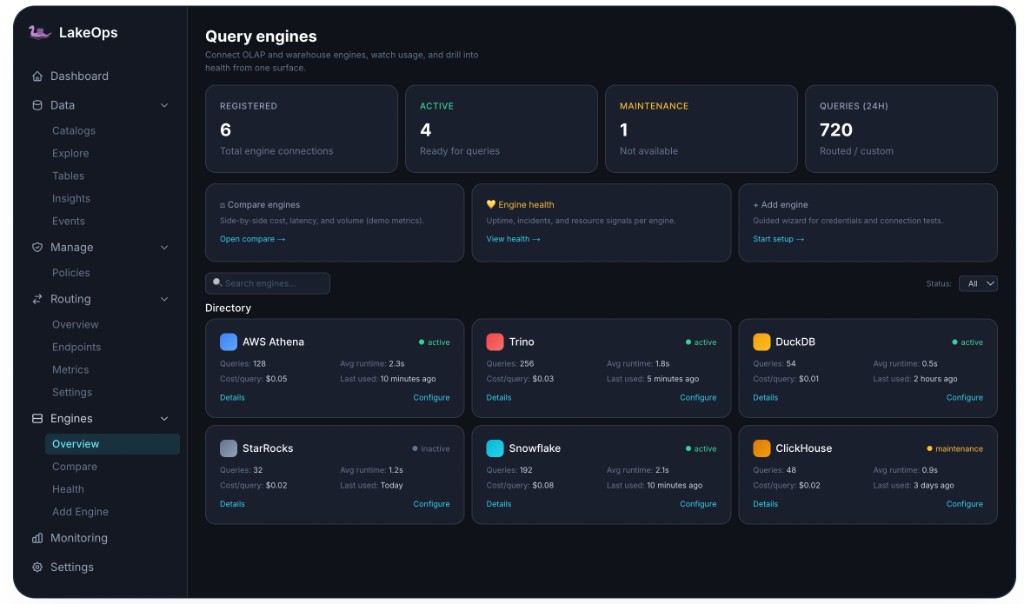
Product tour
Engine management from one console
Register engines, compare performance, monitor health, and route traffic — without per-engine scripts or duplicate dashboards.
Powered by QueryFlux
QueryFlux is an open-source, Rust-based SQL proxy that provides multi-engine query routing with protocol translation, capacity management, and observability. It works as a standalone proxy — and gains intelligent optimization when connected with LakeOps.
QueryFlux standalone
Deploy QueryFlux as your multi-engine SQL proxy without any other dependencies. One endpoint replaces N×M driver configurations — clients connect once, the backend topology is config, not code.
4 frontend protocols
Trino HTTP, PostgreSQL wire, MySQL wire, Arrow Flight SQL
6+ backend engines
Trino, DuckDB, StarRocks, Athena, ClickHouse, Snowflake, and more
Intelligent routing rules
Protocol-based, header-based, regex, client tags, Python script logic
SQL dialect translation
sqlglot-backed conversion across 31+ SQL dialects automatically
Per-group capacity & queuing
Concurrency limits, overflow queuing, and fallback routing per cluster group
Observability built in
Prometheus metrics, Grafana dashboards, QueryFlux Studio UI, Admin API
QueryFlux + LakeOps
When connected with LakeOps, QueryFlux gains access to table telemetry, query history, and optimization signals — enabling intelligent routing decisions that go beyond static rules.
Table-health-aware routing
Route queries away from tables with fragmented manifests or high delete file counts to engines that handle degraded state better
Query-pattern learning
LakeOps telemetry feeds historical latency and cost data per query shape — routing improves automatically over time
Optimization-driven engine expansion
As LakeOps compacts and sorts tables, more engines become viable for each query — expanding routing options dynamically
Unified cost model
Combine query routing cost data with compaction compute savings for full lake-wide cost visibility and optimization
Policy-driven automation
Set cost ceilings, latency targets, and priority rules — LakeOps enforces them across routing and table optimization together
Lakehouse Control Plane
Cost down. Performance up.
Agentic AI ready.
Explore every capability of the LakeOps control plane — from autonomous maintenance and intelligent compaction to multi-engine routing and agentic AI.
Intelligent Lakehouse
A unified control plane that understands your lake end-to-end — tables, engines, queries, and costs — and acts on it autonomously.
Read articleAutonomous Maintenance
Snapshot expiration, manifest rewrites, orphan cleanup, and metadata — automated, scheduled, and safe.
Explore maintenanceIntelligent Compaction
Rust-based engine that organizes data by real query patterns — every cycle cuts IO, shrinks file counts, and speeds up reads.
Explore compactionMulti-Engine Routing
Route queries across Trino, Spark, Snowflake, and more — optimized for cost, latency, or throughput per workload.
Explore routingAgentic AI Management
Agent-native MCP interface, guardrails, and a self-optimizing lake ready for AI agents, feature stores, and autonomous pipelines.
Explore AI enablementObservability & Governance
Table health, engine metrics, cross-system telemetry, and policy-driven governance from one control plane.
Explore observabilityThe problem
Why multi-engine estates need a routing layer
Most organizations run 2–5 query engines. Without intelligent dispatch, every query pays the wrong price, hits the wrong backend, or competes with the wrong workload.
Every query hits the same engine regardless of shape
Without routing, all queries — interactive dashboards, heavy ETL, ad-hoc exploration — land on one engine. CPU-heavy joins pay scan-pricing on Athena; selective lookups wait behind batch jobs on Trino.
N×M driver configurations fragment your platform
Each engine requires its own connection strings, credentials, and client libraries. Every team maintains a separate config per engine — adding or removing a backend means coordinating across every consumer.
No cost awareness in query dispatch
Compute-priced backends (Trino, StarRocks) charge for CPU-seconds. Scan-priced backends (Athena, BigQuery) charge for bytes read. Without cost-aware routing, every query pays the wrong pricing model.
SLA violations when workloads compete on a shared cluster
A batch ETL job competing with an interactive dashboard on the same Trino cluster degrades both. Without workload isolation at the routing layer, latency-sensitive queries suffer unpredictably.
Supported engines & infrastructure
Go deeper
Iceberg Lake Data Analytics Optimization
Eight layers that determine query speed — from partition pruning to multi-engine routing.
Iceberg Lakehouse Performance
Query-aware compaction, manifest optimization, and sorted layouts for 12× faster queries.
Iceberg Lakehouse Observability
Table health and engine telemetry that inform routing and maintenance decisions.
Minutes to value with no risk
Connect & collect telemetry
Manual or autonomous management
Operations run & optimize
Observability & governance
Production benchmarks
5.5 TB across 10 production tables
Real workloads. Real data. Batch, streaming, delete-heavy, multi-writer, and terabyte-scale tables — all on the same engine, same hardware.
| Table | Size | Workload | Files (B → A) | Throughput | Time | Notes |
|---|---|---|---|---|---|---|
| balance_snapshots | 1,192 GB | TB-Scale batch | 11,957 → 3,270 | 1,572 MB/s | 11 min | Spark OOM on same hardware |
| user_accounts | 174 GB | Batch | 878 → 400 | 2,269 MB/s | 74s | Single Node |
| events_analytics | 484 GB | Delete-Heavy | 16,128 → 7,198 | 729 MB/s | 11m 21s | 23,433 delete files; 551M rows removed |
| raw_sdk_events | 8 GB | Streaming | 42,633 → 69 | 167 MB/s | 138s | 99.8% file reduction |
| site_traffic | 292 GB | Multi-Writer | 2,740 → 754 | 1,465 MB/s | 3m 25s | Single partition |
| cluster_registry | 322 GB | Batch | 998 → 440 | 2,522 MB/s | 2m | Peak throughput |
Compaction cost per TB
Normalized to Spark = 100%
Source: 200 GB (~1 TB uncompressed) benchmark. Spark cost index 100 vs LakeOps 10.
Self-improving: same table, zero config changes
balance_snapshots — 1.192 TB across consecutive runs
Same data and hardware; planner learns workload telemetry and improves runtime from 22 to 11 minutes.
See routing in action on your workloads
Connect your engines and get a routing analysis in minutes — see which queries should move, how much you'd save, and which engines to add or consolidate.